Nasdaq 100 Index
No trades
About Nasdaq 100 Index
The NASDAQ-100 is an index that is constituted by 100 of the largest companies listed on the NASDAQ stock exchange, which is the second largest in the world only after the New York Stock Exchange by market capitalization. The companies that are listed in this index range from a variety of industries like Technology, Telecommunications, Biotechnology, Media, and Services. The NASDAQ-100 was first calculated in January 31 of 1985 by NASDAQ and it is a modified capitalization-weighted index. This index has been of good reference to investors that want to know how the stock market is performing without financial services companies, this given that the index excludes financial companies.
Related indices
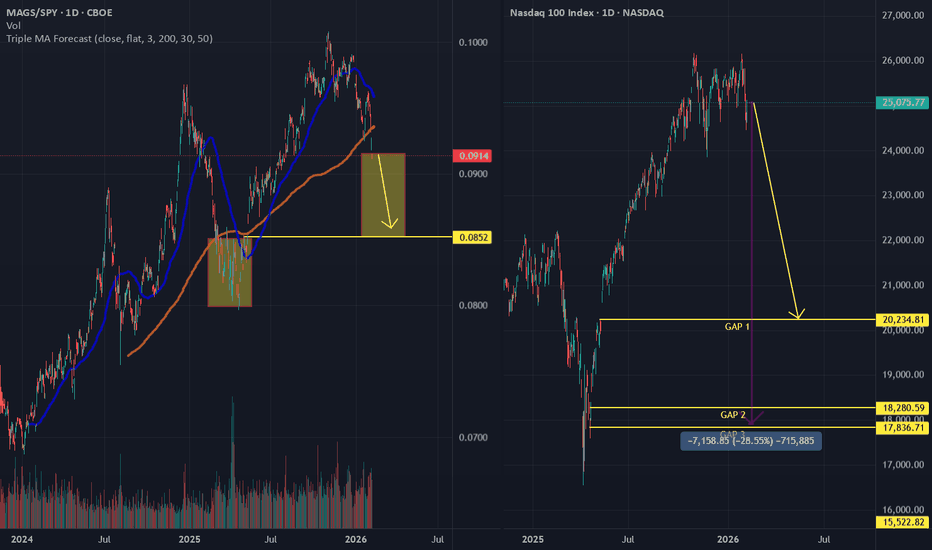
Nasdaq 100 — Distribution? A Familiar Warning Sign...Back in October, when Bitcoin was trading well above 100k, I raised a rhetorical question:
👉 Were those three months of range trading above 100k actually distribution, not reaccumulation?
The market eventually answered.
It was distribution.
And today, BTC is trading in what many would define as b
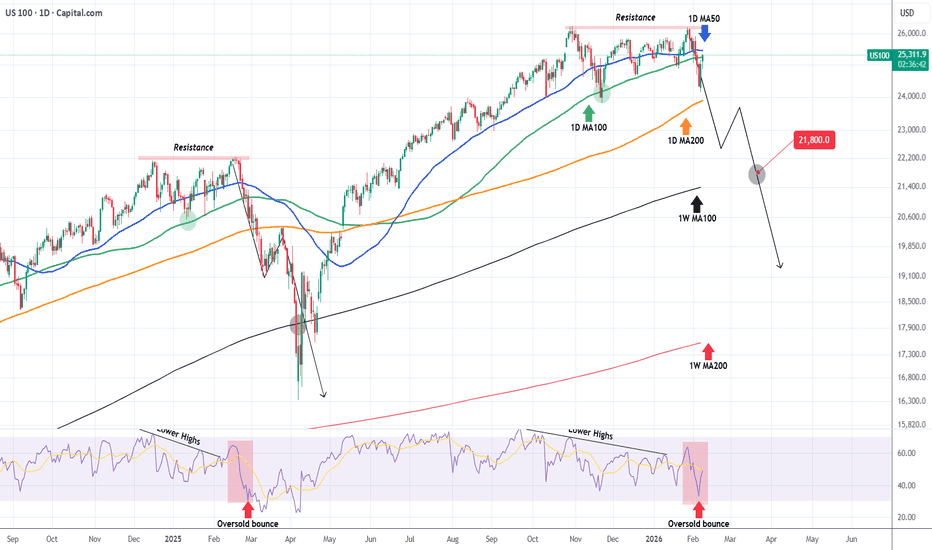
NASDAQ 's long-term consolidation resembles prior peaks.Nasdaq (NDX) has been practically trading sideways since October 30 2025. This 3-month consolidation resembles Nasdaq's last aggressive correction that started in late February 2025. As you can see both have a Resistance Zone that kept the consolidation valid until a 2nd rejection that (in the 2025
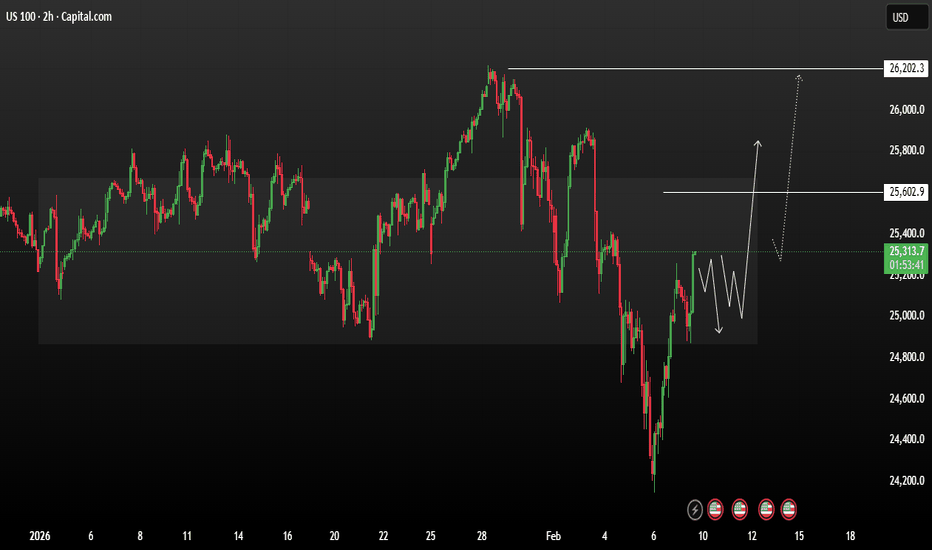
USNAS100 consolidation bullish range formationUS100 trading in a broad consolidation a rebound Price recently formed a strong bullish recovery from the February low near 24,300, followed by a corrective pullback and short-term range formation.
Tecnically Price is currently trading around 25,260, consolidating above the lower support zone near
The Simplest Trading Strategy Nobody Talks AboutOpen charts. Open six timeframes. Start “analyzing.” and end up more confused than when you started. Daily, 4H, 1H, 15M, 5M, even M1… and somehow you still missed the real move?
Its because, you are looking everywhere and nowhere at the same time.
Problem is not having a simple repeatable plan,
USNAS100 | Data Week Keeps Nasdaq Under PressureUSNAS100 | Futures Quiet Ahead of Key U.S. Jobs Data
Nasdaq futures remained subdued as investors awaited the delayed U.S. employment report, while continuing to monitor corporate earnings and the broader economic outlook.
Technical Outlook
The Nasdaq maintains a bearish structure while trading be
NAS100 H4 | Bullish RiseThe price is falling towards our buy entry level at 25,126.66, which is an overlap support.
Our stop loss is set at 24,342.56, which is a swing low support.
Our take profit is set at 25,843.81, which is a pullback resistance.
High Risk Investment Warning
Stratos Markets Limited fxcm.com Stratos
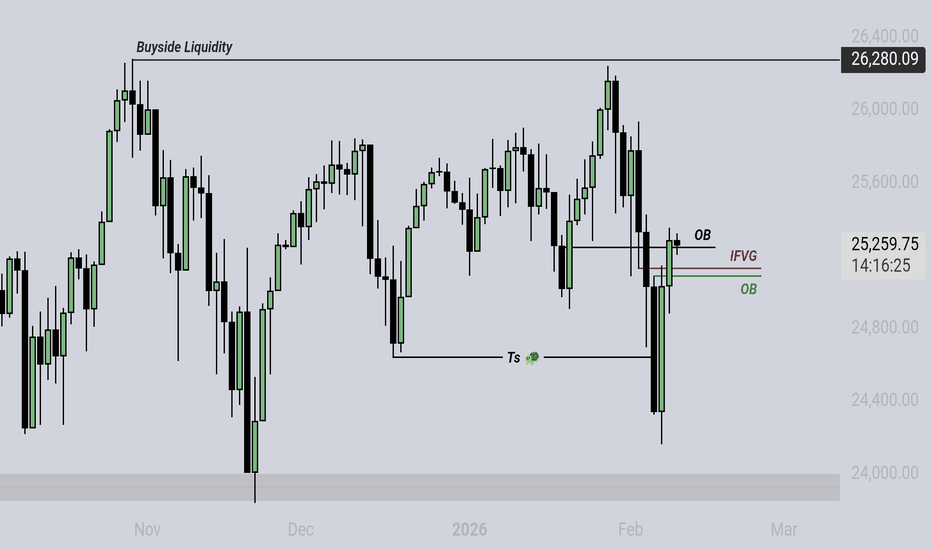
Most Traders Misunderstand Engulfing Candles… Here’s What I SeeI see it everywhere:
A big red candle appears → people immediately call it a bearish engulfing.
But after watching price action for a while, I realised something uncomfortable:
👉 Not every strong candle is an engulfing.
👉 And not every engulfing actually means reversal.
In the highlighted example
See all ideas
Summarizing what the indicators are suggesting.
Oscillators
Neutral
SellBuy
Strong sellStrong buy
Strong sellSellNeutralBuyStrong buy
Oscillators
Neutral
SellBuy
Strong sellStrong buy
Strong sellSellNeutralBuyStrong buy
Summary
Neutral
SellBuy
Strong sellStrong buy
Strong sellSellNeutralBuyStrong buy
Summary
Neutral
SellBuy
Strong sellStrong buy
Strong sellSellNeutralBuyStrong buy
Summary
Neutral
SellBuy
Strong sellStrong buy
Strong sellSellNeutralBuyStrong buy
Moving Averages
Neutral
SellBuy
Strong sellStrong buy
Strong sellSellNeutralBuyStrong buy
Moving Averages
Neutral
SellBuy
Strong sellStrong buy
Strong sellSellNeutralBuyStrong buy
Displays a symbol's value movements over previous years to identify recurring trends.


