Gold Under Pressure Time To Short XAUUSD?Gold (XAUUSD) is currently trading around 3533, and bearish momentum is gaining strength as sellers dominate the market. Price action indicates a strong rejection from the recent highs, signaling potential continuation to the downside. The next major target is 3450, and if selling pressure remains strong, we could see further dips toward deeper support zones. Keep an eye on key levels and trend confirmations before entering positions. Maintain strict risk management and adjust positions according to volatility. A break below current support could open the way for extended bearish movement, making this a crucial opportunity for short traders."
CFDs on Gold (US$ / OZ)
3,632.591USDR
−3.173−0.09%
As of today at 20:08 GMT
USD
No trades
GOLD trade ideas

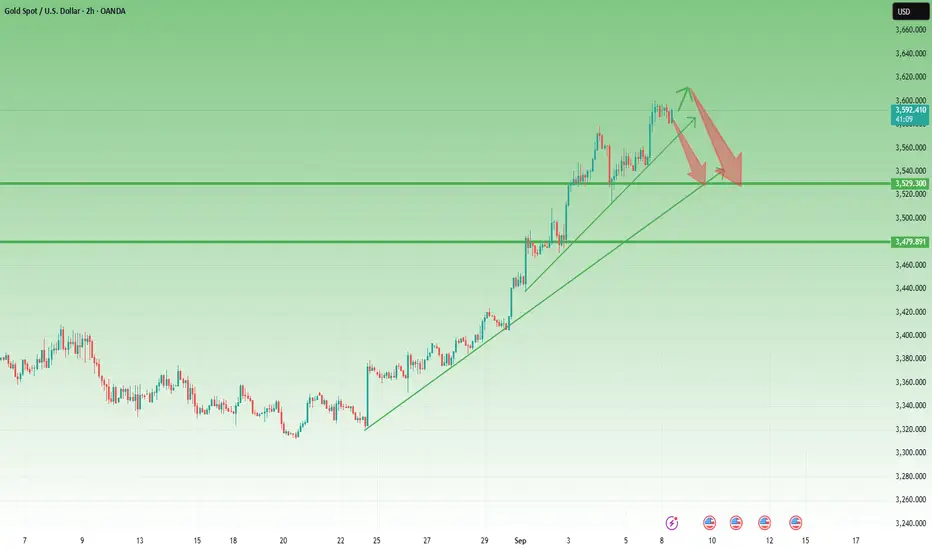
Fearless Bulls, Straight-Line Rise – But Mean Reversion CallsLast week Gold bulls were fearless – we witnessed three all-time highs within a single trading week. The market closed on Friday just below 3600, locking in an impressive 1,500 pips weekly gain. There is no doubt: the trend remains firmly bullish.
But let’s add some perspective. Even if XAUUSD were to drop 1,000 pips from current levels, that move would count as a minor correction within the dominant bullish trend. That’s how extended this rally has become.
📌 Another element supporting the correction scenario is the parabolic nature of the latest move. From the 3300 zone, the rally has been almost a straight vertical line, leaving gold strongly overextended and far away from the mean. Markets rarely sustain such deviation without at least a temporary pullback.
🔑 Trading Plan: While acknowledging the risks of counter-trend setups, I will look for short opportunities. In my view, there is more room to the downside than upside in the short term.
Target for correction: 3530 confluence support zone.
As always, the trend is still bullish, but corrections are part of the game. A disciplined trader must know when to step aside – and when to take the contrarian shot. 🚀
XAUUSD: Very Risky for Either SideXAUUSD has recently seen a strong move to the upside. But I believe that is about to end.
A correction after such a move up is high probability, as price is starting to show early signs that sellers are stepping in discreetly.
I would target a level at around 3,400. But only price will give us some obvious signs of selling pressure first.
And, if price gives us a confirmation cue here, that might be the signal to get involved: not just in candlestick structure but also in volume behavior.
The second scenario, would be for the move to continue more to the upside, but that would require a bigger effort from the buyers.
Leave a comment if you agree, or disagree.


Gold: What is the right price to sell?🏆 Gold: What is the right price to sell?
After receiving several messages asking “what would be a good level to start thinking about selling gold after this amazing rally?”, I’ve decided to prepare a post focused on long-term investing, even though I'm more focused in the short term opportunities.
In the short term, it’s clear for everyone here on TradingView, gold has broken out of a textbook ascending triangle and is pushing into new all-time highs 📈.
But… how far can this madness go!?!?
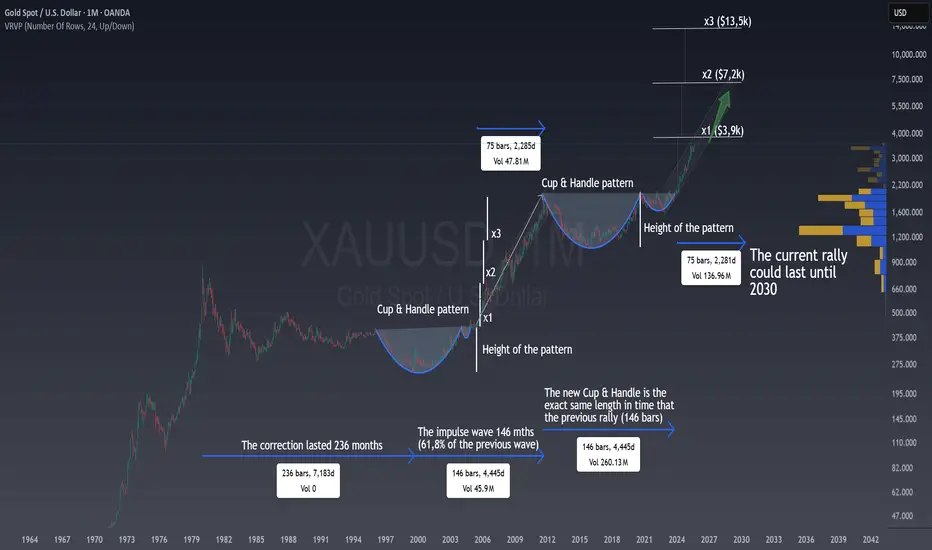
To answer, I’ve taken a long-term perspective , analyzing the monthly chart to give a broader view.
First of all, let me say that nobody knows exactly where gold will stop , and anyone who claims otherwise is lying. What I can do is highlight the levels that are more probable than others, based on technical patterns, Fibonacci extensions, and how gold has reacted to these in the past.
Gold has been one of the strongest long-term performers in financial history, and the monthly chart tells us that the story might be far from over.
🔹 In the past, a Cup & Handle pattern pushed prices nearly 3x the height of the formation.
🔹 Right now, gold is completing another massive Cup & Handle, and we’re already near the x1 target ($3,900).
🔹 The rally could extend to x2 ($7,200) or even x3 ($13,500) until 2030.
⏳ The timing also aligns : the impulse wave after the last correction lasted 146 months, and this new rally is following a very similar time structure. According to the chart, this cycle could realistically stretch until 2030. Of course, with volatility but probably with a strong trend year after year.
👉 For long-term investors , this means:
Any deep correction = opportunity 🎯
Gold remains one of the best hedges against uncertainty 🌍
Patience could be rewarded with a historic move 🚀
I’m personally very bullish on gold’s long-term outlook, and I see this asset as a must-hold in a diversified portfolio. Corrections will come , but the structure suggests they’ll just be steps on the way higher. In the chart, you can also see a projection of the previous rally channel, Fibo time levels of the past correction being amazingly perfect and how it's realated with the current one, but it's not that important for the forecasted levels, so I don't want to overwhelm you :)
Furthermore, many countries have been shifting from sovereign debt to gold in their reserves , and this trend has been accelerating in recent years.
✨ The rally might just be getting started.
GOLD → The uncertainty factor before the news. Down / up?FX:XAUUSD after updating another high to 3578 went into the phase of profit taking before two busy news days. The trend is aggressively bullish, but the risks of correction are quite high due to the uncertainty factor....
The price pulled back from record highs amid profit taking and reduced panic in the bond market. The dollar stabilized, but remains under pressure due to expectations of Fed rate cuts this year. The key event will be the publication of US employment data (NFP) on Friday.
A correction after a sharp rise is a natural reaction, but the expectation of Fed policy easing is supporting the metal's price.
Geopolitics: Trade risks (Trump's tariffs) mitigate gold's fall.
Gold's correction so far looks like a pause before further movement. The main driver is NFP data, which will determine Fed rate sentiment and USD direction. But, today all eyes are on ADP Nonfarm, Initial jobless claims, and ISM data. Unexpected data may intensify the sell-off....
Resistance levels: 3546, 3559, 3563
Support levels: 3526, 3508
It is difficult to determine the news reaction in advance, we will have to orient ourselves after the fact. Technically, I expect a deeper correction for a healthy market. I expect a retest of the 3560 zone and further decline to local liquidity zones.
Regards R. Linda!

GOLD: Continues to be strong and could possibly reach 3700GOLD: Continues to be strong and could possibly reach 3700
From our analysis of the higher timeframe, gold rose from 3550 to 3608 and the daily volume on the rise seems to be high.
We only had a small correction on September 4th to 3511. It can be clearly seen that it was the only red candle from August 26th. This candle was just a correction and the candles are all green indicating further growth.
The price has been rising without any significant correction since August 20th. If this momentum continues, 3650 and 3700 will be the next targets.
It remains highly manipulated.
It is impossible for the Gold to move higher when the FED does not want to cut rates. But even when they are preparing to cut rates, gold will move higher again.
Something bigger is behind all this growing momentum.
You may find more details in the chart!
Thank you and Good Luck!
❤️PS: Please support with a like or comment if you find this analysis useful for your trading day❤️

Gold may move up a little and then start to declineHello traders, I want share with you my opinion about Gold. The market for Gold has transitioned from a prolonged balancing phase into a strong directional trend, following a decisive breakout from its prior multi-week big range. This breakout, originating from the support area near the 3445 level, shifted market control firmly to buyers and initiated a new impulsive phase. The price action for XAU since then has been characterized by a steep, high-momentum rally, which is being guided by an ascending mirror line. Currently, the asset is at a new high, continuing to push upwards along this aggressive trendline. However, such accelerated trends are often unsustainable and can signal that the market is becoming overextended and due for a correction. I expect that after a potential final push higher, the price will stage a sharp reversal, with enough selling pressure to cause a breakdown below the steep mirror line. A break of this dynamic support would be the first confirmation that a corrective phase has begun. Therefore, the TP for this corrective scenario is logically placed at 3520 points. Please share this idea with your friends and click Boost 🚀

Gold with bullish momentum still intactGold touched above the 3600 level, with bullish momentum still intact. If the market pulls back, watch the 38% Fibonacci retracement level as a potential support. Overall, gold has gained 4.75% in one week, suggesting that a minor consolidation could occur before the next move toward the upper resistance around 3620.
President Donald Trump’s recent move on Friday exempted graphite, tungsten, uranium, gold bullion, and other metals from tariffs, while subjecting silicon products to new levies.
You any find more details in the chart.
Trade wisely best of Luck.
Ps; Support with like and comments for better analysis.


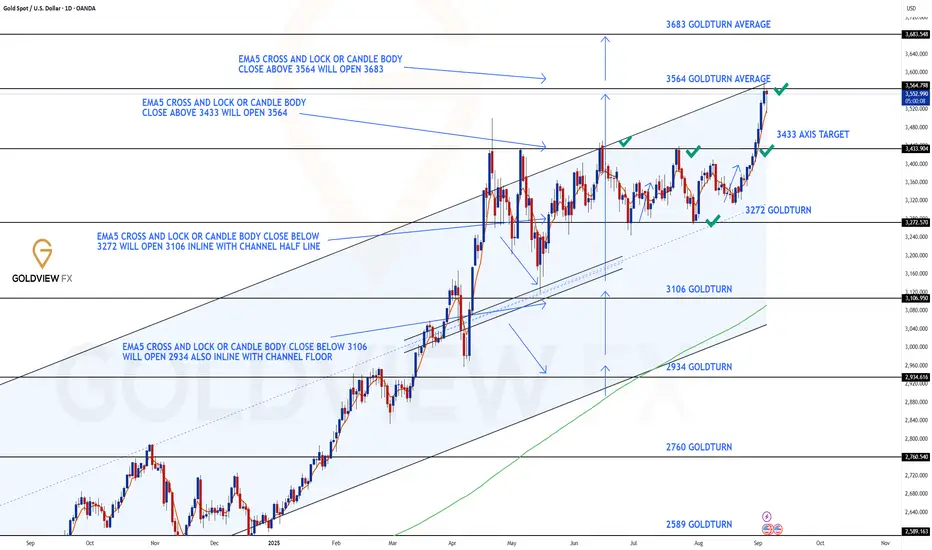
DAILY CHART ROUTE MAP UPDATEHey Everyone,
After completing our 1h and 4H chart this week, please now see update on our daily chart idea that we have been tracking. This chart idea has also played out to perfection!!
Sunday we advised that 3433 had now produced a candle body close above this level leaving gap target open for 3564 - This target is now complete!!
🔹 GAP TARGET 3564 - DONE
We will now look for a body close and/or ema5 cross and lock above this level to confirm a continuation. Failure to lock will confirm a rejection into the lower Goldturns for support.
Thanks as always for your support.
Mr Gold
GoldViewFX
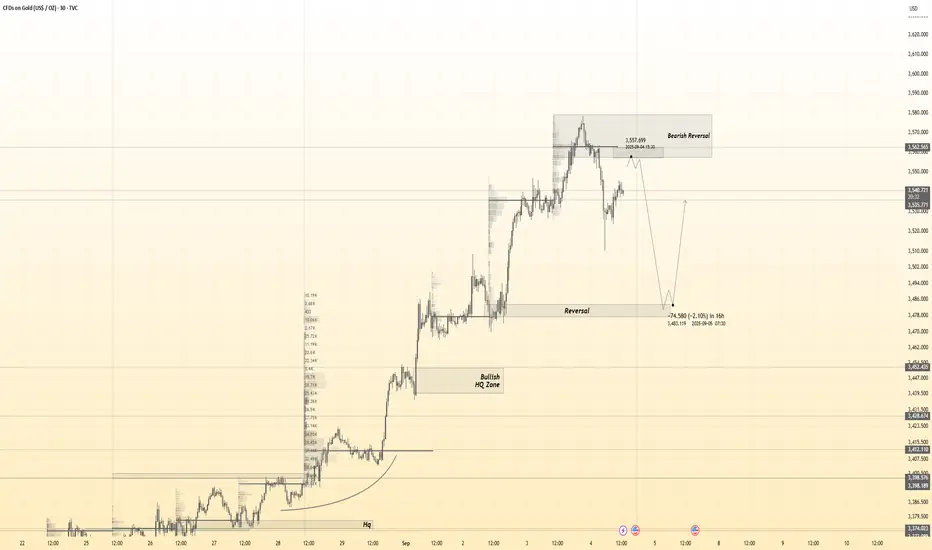
Rebound or Trap? Why I’m Selling RalliesYesterday’s Move
After printing a fresh ATH, profit-taking started late in the New York session. This was followed by stronger selling pressure during the Asian hours, which dragged the price overnight down to 3510. Currently, we see a rebound, with price trading around 3530.
Key Question
Is this rebound the start of a recovery—or just a pause before another leg down?
Why I Expect the Correction to Continue
- The market sold off 650 pips from the new ATH, confirming a local top.
- Momentum becomes fragile after 2k pips rise in just 10 days
- Selling pressure could easily return, especially if buyers struggle to hold above 3550.
Trading Plan
I’ll be looking to sell rallies against the recent top, targeting first the 3500 psychological level, and then the 3470 technical confluence support.

XAUUSDHello Traders! 👋
What are your thoughts on XAUUSD?
Gold has been moving within a medium-term ascending channel and recently managed to break above a major resistance area that had previously rejected price multiple times.
Currently, the price is facing a psychological and technical barrier at the $3500 level, acting as the next resistance.
Price is expected to consolidate slightly below $3500 before attempting another push higher.
As long as price holds above the broken resistance and stays within the ascending channel, the bullish outlook remains valid.
A successful breakout above $3500 could open the path toward targets at $3600 – $3700-$3900 in the medium term.
Don’t forget to like and share your thoughts in the comments! ❤️

GOLD → As prices continue to rise, so do the risks...FX:XAUUSD continues to rise, setting new highs. New ATH 3659. Focus on current consolidation, as the structure remains bullish...
Gold hit a new record high, surpassing $3,650, amid a weakening dollar and growing expectations of aggressive Fed policy easing. However, overbought conditions and profit-taking risks may limit further growth.
The USD is at 7-week lows due to fears of stagflation and deteriorating employment data. The probability of a rate cut on September 17 is 89.4% (25 bps), with a chance of 50 bps. Markets are expecting more than two cuts in 2024.
Risks for gold: “Sell the fact”: If the NFP revision turns out to be weak (as expected), investors may start to take profits.
Technically, gold remains bullish, but a near-term correction is likely due to technical factors and a possible reaction to the data. The long-term trend remains bullish thanks to a weak USD and the Fed's dovish policy.
Resistance levels: 3657, 3675, 3700
Support levels: 3636, 3628, 3620
Gold is consolidating. At the moment, the fundamental background is stable, and no news is expected today except for those that are impossible to predict (comments, rumors, etc.). Before further growth, gold may test the support area and the liquidity hidden behind it.
Best regards, R. Linda!

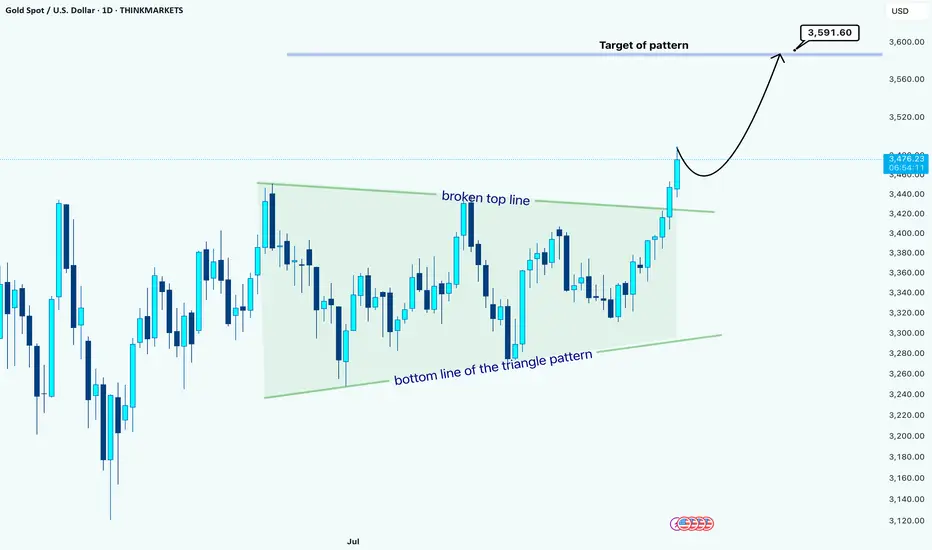
Gold Daily Chart Analysis –> Triangle BreakoutHello guys!
Gold has finally broken out of a large triangle consolidation pattern that has been building for weeks. The price action respected both the top resistance line and the bottom support line multiple times, showing clear compression before the breakout.
🚀 Recently, the price broke above the top line of the triangle, confirming a bullish breakout. This kind of move usually signals the start of a continuation phase with momentum in the direction of the breakout.
Based on the measured move from the triangle formation, the projected target sits around 3,591.60 USD. Price is currently trading near 3,476 USD, which still leaves room for further upside.
💡 Typically, after such a breakout, the market may retest the broken resistance line (now turned support) before resuming its move higher. (but the pullback is not certain now)
Summary:
Pattern: Symmetrical Triangle
Breakout Direction: Bullish
Current Price: 3,476 USD
Target: 3,591.60 USD
As long as Gold holds above the broken triangle resistance, the bias remains bullish toward the projected target.
Disclaimer: As part of ThinkMarkets’ Influencer Program, I am sponsored to share and publish their charts in my analysis.
THE KOG REPORT - NFP THE KOG REPORT – NFP
This is our view for NFP, please do your own research and analysis to make an informed decision on the markets. It is not recommended you try to trade the event if you have less than 6 months trading experience and have a trusted risk strategy in place. The markets are extremely volatile, and these events can cause aggressive swings in price.
For this months NFP, due to the aggressive stretch on gold upside, we’re only looking for the extreme levels to attempt the trade. Even then, we’re of the view that we will let this play out for today and next week look for a clean reversal before getting in and taking what is needed.
We have the immediate level of support below 3550-40, which needs to be held in order to attempt the upside levels of 3580-5 and if that level is broken 3603-10. It’s that higher level that we feel if attempted, could present a decent opportunity to attempt the short trade, unless broken of course.
Lower down, the red box bias level is sitting at 3540 which needs a clean break below to then confirm the bearish move has started and we can then either capture the retracements in attempt to target the 3480-5 level or, wait lower for price to exhaust, and once a clean reversal is formed, attempt the long trade back upside.
The ideal scenario here is a break above the 3585 level an attempt on 3600, exhaustion there and then a possible short for next week. It’s been a choppy week but we’ve hit all of our bullish targets so lets observe more than we trade today.
RED BOXES:
Break above 3555 for 3561, 3568, 3576 and 3588 in extension of the move
Break below 3540 for 3533, 3530, 3520, 3506 and 3490 in extension of the move
Please do support us by hitting the like button, leaving a comment, and giving us a follow. We’ve been doing this for a long time now providing traders with in-depth free analysis on Gold, so your likes and comments are very much appreciated.
As always, trade safe.
KOG

THE KOG REPORT - UpdateEnd of day update from us here at KOG:
Gold continues the stretch after the break out of a long-term range. We have to be cautious here now as the measured move is slightly higher so a pull back is well overdue. We managed to stay above the region mentioned in the report and hit the targets we wanted completing the red box targets and targeting that high as mentioned. A pull back would have been nice however in order to load again.
Now, we have resistance above at the 3540-2 level and support 3420 which if held can take us higher into the 3555 level. We need to wait now for a structure to form if we're going to stay up here, otherwise, we'll look for the reversal as the liquidity indicators are showing extreme levels.
RED BOXES:
Break above 3480 for 3484✅ and 3490✅ and 3502✅ in extension of the move
Break below 3465 for 3459, 3455 and 3449 in extension of the move
As always, trade safe.
KOG


Gold Nay Hit 3600 Range in coming Days Market TalkGold prices are consolidating with bullish potential, and could target the 3600 level soon and even 3900 per ounce over the longer term if the spot price sustains a decisive breach above the 3500 zone, according to a note by Philip Nova's and Priyanka Sachdeva.
The analysts note that an aggressive U.S. tariff stance has heightened geopolitical risks, prompting increased demand for safe-haven assets like gold. Additionally, expectations for a peak in rate-cut cycles are contributing to a favourable backdrop for gold.
If gold breaks and holds above the 3549 resistance level, it could trigger a strong bullish move toward the next psychological target of 3600.
You may find more details in the chart.
Trade wisely best Of Luck Buddies.
Ps; Support with like and comments for better analysis Thanks for Support.

Gold Pullback Toward 3,510 as BRICS Demand and Dollar Weakness.Hey Traders, in today's trading session we are monitoring XAUUSD for a buying opportunity around the 3,510 zone. Gold is trading in an uptrend, with price currently correcting toward this key support/resistance level.
Structure: The broader bias remains bullish, but price is retracing after recent highs.
Key level in focus: 3,510 — an important zone where buyers may look to step in and resume the upward trend.
Fundamentals: Geopolitical alignment among Russia, China, India, and North Korea strengthens the case for continued gold purchases by BRICS central banks. At the same time, the U.S. Dollar Index (DXY) has broken below 98.400 support and could retrace further to the downside, adding to gold’s bullish backdrop through negative correlation.
Trade safe,
Joe.

Lingrid | GOLD Price Deceleration: Short-Term Retracement The price perfectly fulfilled my previous idea . OANDA:XAUUSD has reached a fresh all-time high within the upward channel but is now showing price deceleration near the 3,660 resistance zone, suggesting exhaustion. Price action is forming smaller candles in the profit-taking area, indicating weakening bullish momentum. A rejection here could trigger a corrective move toward 3,590, with deeper downside potential toward 3,470 if sellers sustain control. The broader structure highlights a possible correction unfolding following A-B-C movement from this overextended zone.
💡 Risks:
A softer US CPI could reignite bullish flows and invalidate the sell scenario.
Renewed geopolitical tensions may increase safe-haven demand and push gold higher.
A dovish Federal Reserve shift could restore strong buying pressure and reverse any correction.
If this idea resonates with you or you have your own opinion, traders, hit the comments. I’m excited to read your thoughts!

GOLD (XAUUSD): New ATH & More GrowthThe price of 📈GOLD reached a new all-time high today following the release of US news.
The market has successfully surpassed and closed above a previously identified resistance level within an accumulation pattern on a 4-hour timeframe.
Further upward movement is anticipated, and the pair is expected to approach the 3620 level in the near future.

GOLD: A Short-Term Trading Perspective - 15-Minute ChartGOLD: A Short-Term Trading Perspective - 15-Minute Chart
During the early European morning, Gold fell by almost 1.9% from 3578.5 to 3511.2
This correction was driven by profit taking given that we are in a strong uptrend.
At the moment, gold remains bullish on all timeframes.
On the 15-minute chart, if gold holds strong above 3533, it has higher chances of rising to 3552.6 and 3575.
If gold experiences another gain, it could test, then it could test 3511 - 3515 before moving higher again.
Overall, gold trading remains very risky.
You may find more details in the chart!
Thank you and Good Luck!
❤️PS: Please support with a like or comment if you find this analysis useful for your trading day❤️

Gold 30Min Engaged ( Buy And sell Reversal Entry Detected )Time Frame: 30-Minute Warfare
Entry Protocol: Only after volume-verified breakout
🩸Bearish Reversal : 3557
🩸Bullish Reversal : 3484
➗ Hanzo Protocol: Volume-Tiered Entry Authority
➕ Zone Activated: Dynamic market pressure detected.
The level isn’t just price — it’s a memory of where they moved size.
Volume is rising beneath the surface — not noise, but preparation.
🔥 Tactical Note:
We wait for the energy signature — when volume betrays intention.
The trap gets set. The weak follow. We execute.