GOLD Breakout Done , Long Setup Valid To Get 150 Pips !Here is My 15 Mins Gold Chart , and here is my opinion , we finally above 3384.00 and we have a 30 Mins Candle closure above it And Perfect Breakout , so we have a good confirmation now to can buy it and we can targeting 100 to 150 pips .
Reasons To Enter :
1- New Support Created .
2- Bullish Price Action .
3- Bigger T.F Giving Good Bullish P.A .
4- Clean Breakout .
CFDs on Gold (US$ / OZ)
3,346.150USDR
−10.517−0.31%
As of today at 14:32 GMT
USD
No trades
GOLD trade ideas

GOLD ROUTE MAP UPDATEHey everyone,
Another PIPTASTIC day on the charts today with our chart idea playing out as analysed.
The retracement range continued to provide support once again, allowing us to buy dips, inline with our plans.
We’re now range-bound between 3354 and 3377.
As long as 3354 holds, we can expect continued bounces, tracking the movement upward.
We will keep the above in mind when taking buys from dips. Our updated levels and weighted levels will allow us to track the movement down and then catch bounces up.
We will continue to buy dips using our support levels taking 20 to 40 pips. As stated before each of our level structures give 20 to 40 pip bounces, which is enough for a nice entry and exit. If you back test the levels we shared every week for the past 24 months, you can see how effectively they were used to trade with or against short/mid term swings and trends.
The swing range give bigger bounces then our weighted levels that's the difference between weighted levels and swing ranges.
BULLISH TARGET
3403
EMA5 CROSS AND LOCK ABOVE 3403 WILL OPEN THE FOLLOWING BULLISH TARGETS
3422
EMA5 CROSS AND LOCK ABOVE 3422 WILL OPEN THE FOLLOWING BULLISH TARGET
3439
BEARISH TARGETS
3377 - DONE
EMA5 CROSS AND LOCK BELOW 3377 WILL OPEN THE FOLLOWING BEARISH TARGET
3354 - DONE
EMA5 CROSS AND LOCK BELOW 3354 WILL OPEN THE FOLLOWING BEARISH TARGET
3329
EMA5 CROSS AND LOCK BELOW 3329 WILL OPEN THE SWING RANGE
3304
3281
As always, we will keep you all updated with regular updates throughout the week and how we manage the active ideas and setups. Thank you all for your likes, comments and follows, we really appreciate it!
Mr Gold
GoldViewFX

Gold Coils for a Big Move – Here’s My Plan1. Market Recap
Monday was a nasty day for Gold bulls, with the price slowly bleeding lower until it reached 3340 support.
Since then, price action has been trapped in an annoying range, swinging violently between support and resistance — just like in the final days of last week. Even yesterday’s CPI release failed to spark a real directional move, adding nothing but short-lived noise.
2. The Key Question
Has Gold finished consolidating, and is it ready to break out of this range?
3. Why I Lean Bullish at this Moment
• The recent spike down to 3330 support aligns perfectly with the Fibonacci golden zone.
• Stabilization around 3350 suggests the market is finding a short-term balance point.
• Resistance at 3360 is the critical barrier — once cleared, it could confirm a reversal.
4. Trading Plan
I hold a bullish bias for the near future.
• A confirmed break above 3360 could open the path to 3380 resistance and possibly a fresh test of 3400.
• A sustained drop below 3330 would cancel this scenario and shift the focus back to the downside.
5. Closing Note
Gold is coiled in a range — the next breakout will set the tone. Let’s see if the bulls have the fuel for a move higher. 🚀
Disclosure: I am part of TradeNation's Influencer program and receive a monthly fee for using their TradingView charts in my analyses and educational articles.

GOLD NEXT MOVE (expecting a bearish move)(13-08-2025)Go through the analysis carefully and do trade accordingly.
Anup 'BIAS for the day (13-08-2025)
Current price- 3370
"if Price stays below 3382, then next target is 3360, 3350 and 3320 and and above that 3400 ".
-POSSIBILITY-1
Wait (as geopolitical situation are worsening )
-POSSIBILITY-2
Wait (as geopolitical situation are worsening)
Best of luck
Never risk more than 1% of principal to follow any position.
Support us by liking and sharing the post.

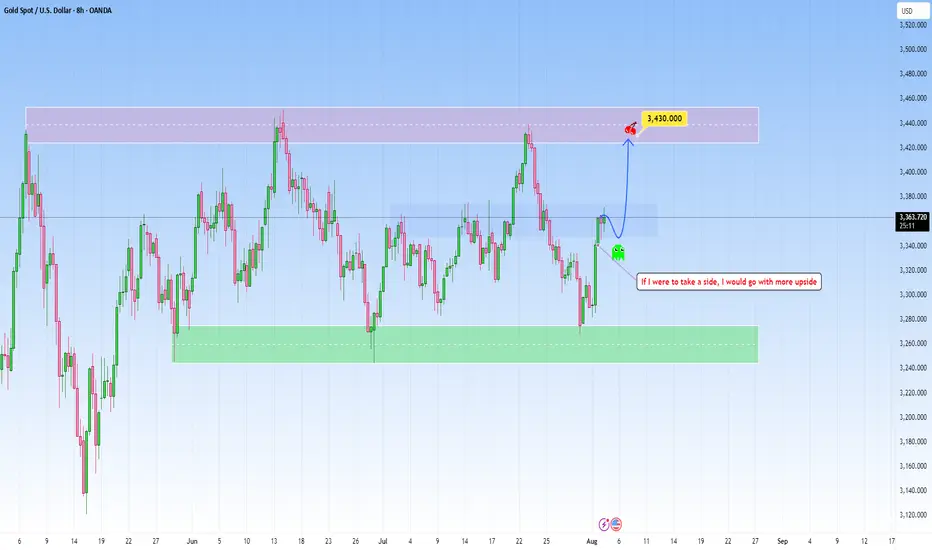
GOLD undecided: Looking for a positive outlookThe current market context on GOLD seems undecided and heavily influenced by news release and macroeconomic catalysts. The recent reversal from the support was pretty decisive, catching short-sellers off guard and forcing them to cover positions.
However, the structure has yet to produce a clean breakout beyond the mid-range, suggesting a lack of strong conviction from either side.
The probability of a pause or reversal here under this circumstances may increase substantially as well. But if I were to take a side I would definitely choose more upside , before any correction begins.
This is a high-risk zone for positioning without confirmation. The market is potentially preparing for a breakout or a fakeout, and patience is key. Wait for clear signs of intent before committing.
THE KOG REPORT - UpdateEnd of day update from us here at KOG:
We did not expect an open like that! Honestly, we were expecting a low volume day of ranging and choppy price action like last week, but from the get go, gold was off! It resistance the level we wanted, came down in to the 3370-5 level we wanted, gave us nearly 100pips, then continued to break through the bias level and complete all of our target prices. Because we didn't get the opportunity to short it, we only managed to capture some nice tap and bounces to walk away with an extremely good pip capture.
So, what now?
We have a red box break with the lower level 3335-40 open but price is struggling here just below 3350. Resistance is the 3365 level which would be a good target from that lower region as long as we support. We'll keep that path shown for now.
KOG’s Bias for the week:
Bullish above 3365 with targets above 3408, 3410, 3415 and above that 3420
Bearish below 3365 with targets below 3359✅, 3355✅, 3350✅ and below that 3345✅
RED BOX TARGETS: (You can see how effective these are so please make use of these together with the analysis and bias we share. It all goes together, without PRICE ACTION knowledge you only have hope)
Break above 3406 for 3407, 3410, 3420, 3429, 3430 and 3435 in extension of the move
Break below 3395 for 3393✅, 3385✅, 3380✅ and 3370✅ in extension of the move
Please do support us by hitting the like button, leaving a comment, and giving us a follow. We’ve been doing this for a long time now providing traders with in-depth free analysis on Gold, so your likes and comments are very much appreciated.
As always, trade safe.
KOG

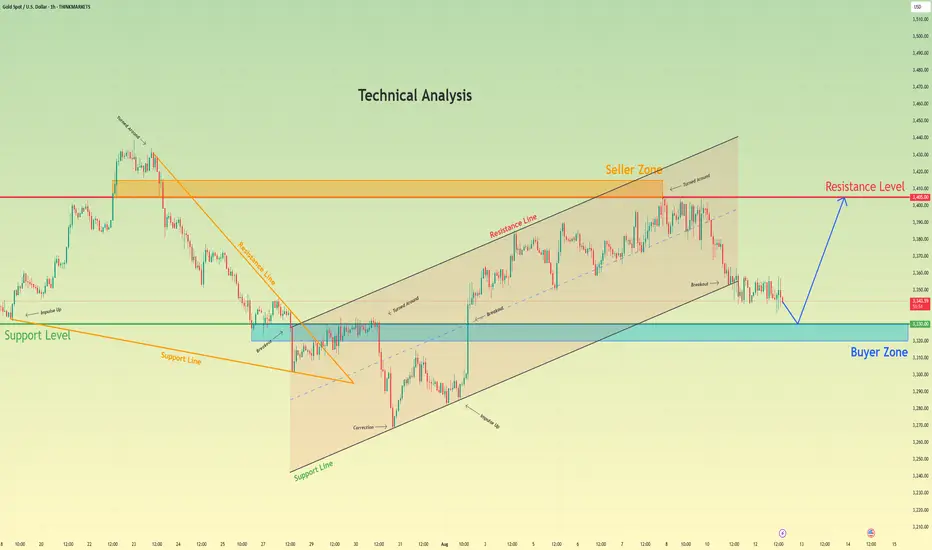
Gold may bounce from support level and rise to resistance levelHello traders, I want share with you my opinion about Gold. The technical narrative for gold has fundamentally shifted from bearish to bullish following a significant breakout from a prior downward wedge. This powerful upward rebound signaled a clear change in market control, invalidating the previous downtrend and establishing a new, constructive market structure. This new structure has taken the form of a well-defined upward channel, which has been guiding the price action higher through a series of impulsive and corrective waves. Currently, the asset is undergoing a natural corrective phase after recently testing the upper resistance line of the channel. This downward correction is guiding the price towards a critical confluence of support located around the 3330 level. This area is significant as it represents the intersection of the channel's ascending support line and a strong horizontal buyer zone. The primary working hypothesis is a long scenario, based on the expectation that buyers will step in to defend this key support confluence and maintain the integrity of the upward channel. A confirmed bounce from this area would likely initiate the next impulsive leg higher within the trend. Therefore, the tp is logically set at the 3405 resistance level, as this represents a full rotation back to the top of the channel and aligns with the major seller zone. Please share this idea with your friends and click Boost 🚀
Disclaimer: As part of ThinkMarkets’ Influencer Program, I am sponsored to share and publish their charts in my analysis.
XAU/USD | Gold at a Turning Point – Breakout or Breakdown Ahead?By analyzing the gold chart on the 4-hour timeframe, we can see that after our last analysis, gold continued its correction and dropped to $3358. It’s currently trading around $3367, and for the bullish scenario to remain valid, we need to see price hold above $3358 and soon close above $3370. If this happens, another bullish move could follow.
Otherwise, if gold breaks and stabilizes below $3358, this scenario will be invalidated, and the alternative outlook suggests further downside toward $3349 and $3339. This analysis will be updated — and don’t forget to show your support, friends!
Please support me with your likes and comments to motivate me to share more analysis with you and share your opinion about the possible trend of this chart with me !
Best Regards , Arman Shaban

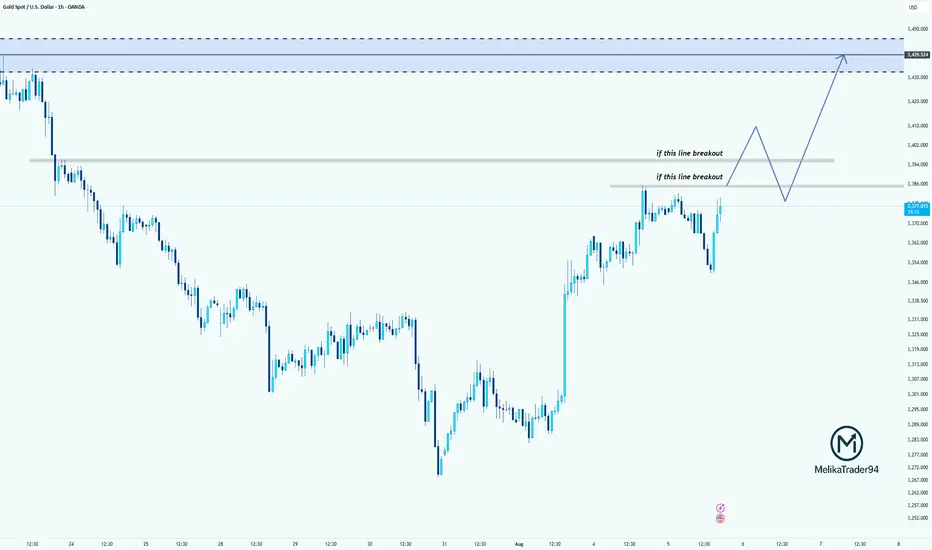
Breakout Levels in Focus for XAUUSDWhy did I say to cancel the last position? because gold is in the critical area!
Price is testing a key resistance area around 3374.
If it breaks above the first resistance level, we may see a bullish continuation toward the second breakout line.
If both levels are broken and retested successfully, the path toward the supply zone at 3430–3440 opens up.
Patience and confirmation are key here!
THE KOG REPORT - UpdateEnd of week update from us here at KOG:
KOG’s bias for the week:
Bullish above 3340 with targets above 3370✅, 3373✅, 3379✅ and above that 3384✅
Bearish on break of 3340 with targets below 3330, 3320 and below that 3310
RED BOXES:
Break above 3365 for 3372✅, 3375✅, 3379✅, 3384✅ and 3390✅ in extension of the move
Break below 3350 for 3346, 3340, 3335 and 3330 in extension of the move
All bullish above targets completed, no breaks below so we need not worry about the bearish below targets.
Not a bad week at all, even with the ranging and choppy price action. As you can see the red boxes shared for free have worked well and held price giving opportunities up and down following the path and the red box targets. Yesterday we also hit the final target we wanted for the week so no complaints.
Today, we haven't done much apart from a few long trades but now, due to it being late session we would like to see how the market closes and prepare for next week.
Support here stands at the 3375 level with resistance sitting at 3410 which is a possibility if we continue to hold. Is it worth taking however, we don't think so.
LEARN AND GENERATE YOUR OWN SIGNALS. You don't need any of us to guide you.
Please support us and the free channel by hitting the like/boost 🚀 button 🙏 on our Tradingview ideas
As always, trade safe.
KOG

Latest Gold Price Update TodayHello, let’s strategize and analyze OANDA:XAUUSD together!
Last week, the gold market went through a highly volatile phase when rumors surfaced that the US would impose a 39% tax on gold bars imported from Switzerland on Thursday afternoon. This news immediately triggered a strong buying surge, pushing the spot price of gold above the critical resistance level of 3,400 USD, although the White House later denied it.
Earlier in the week, gold opened at 3,360 USD and fluctuated multiple times between 3,345 and 3,396 USD/ounce as buying and selling forces battled. Interestingly, even after the tax rumor was debunked, the price of gold only dropped slightly before rebounding and maintaining around 3,400 USD until the end of the week.
According to my analysis, gold is currently correcting and moving around 3,370 USD. The 3,435 USD level (the recent peak) is crucial to watch closely. This level has been tested three times in May, June, and July without being broken, reflecting the consistent strength of the buyers.
Looking further ahead, the 3,500 USD level remains a significant resistance. "I hope the next test will come after a steady upward trend, rather than a quick breakout, as this could lead to a stagnation in the rally," I believe.
The overall market sentiment is also positive: the latest survey shows that about 60% of Wall Street experts predict gold prices will continue to rise, while only 10% foresee a decline, with the rest expecting sideways movement. On the retail side, around 69% of individual investors remain optimistic about gold’s short-term outlook.
What about you? How do you predict gold’s movement?

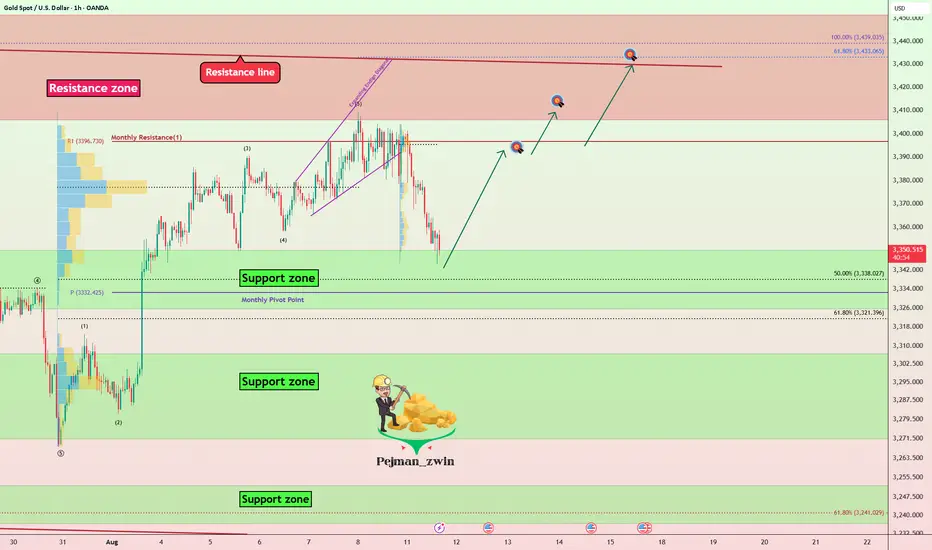
Gold Correction Ending — Time for the Next Rally?Gold ( OANDA:XAUUSD ) is currently moving near the Support zone($3,350-$3,326) and the Monthly Pivot Point .
In terms of Elliott Wave theory , it seems that Gold is completing a corrective wave, and we should wait for the next impulse wave .
I expect Gold to start rising from the Support zone($3,350-$3,326) and rise to at least $3,393 .
Second Target: $3,407
Third Target: $3,427
Note: Stop Loss (SL) = $3,317
Gold Analyze (XAUUSD), 1-hour time frame.
Be sure to follow the updated ideas.
Do not forget to put a Stop loss for your positions (For every position you want to open).
Please follow your strategy; this is just my idea, and I will gladly see your ideas in this post.
Please do not forget the ✅ ' like ' ✅ button 🙏😊 & Share it with your friends; thanks, and Trade safe.

GOLD DUMPS $50 – LIQUIDITY ZONE AHEAD | CPI IN FOCUS! GOLD DUMPS $50 – LIQUIDITY ZONE AHEAD | CPI IN FOCUS!
📌 MARKET RECAP
Gold kicked off the week with a sharp $50 drop, breaking multiple key trendlines and nearby support levels in quick succession.
Main drivers behind the move:
Profit-taking after the recent strong rally.
Stronger USD expectations ahead of CPI data (forecast +0.1% vs previous).
Geopolitical factors – Ukraine–Russia ceasefire talks approaching their conclusion, adding to risk-off sentiment.
🧐 WHAT’S NEXT?
If CPI comes in strong → USD strengthens → Gold could slide further into the 333x – 330x liquidity zone.
If CPI disappoints → USD weakens → Gold may quickly bounce back toward the 337x key level (previous breakdown area) for a retest before deciding direction.
🎯 MMFLOW GAME PLAN
1️⃣ BUY SCALP
📌 Entry: 3331 – 3329
📌 SL: 3325
📌 TP: 3335 – 3340 – 3345 – 3350 – 3360 – 3370 – 3380
2️⃣ BUY ZONE
📌 Entry: 3310 – 3308
📌 SL: 3304
📌 TP: 3314 – 3318 – 3322 – 3326 – 3330 – 3335 – 3340 – 3350 – 3360 – ???
3️⃣ SELL SCALP
📌 Entry: 3363 – 3365
📌 SL: 3370
📌 TP: 3360 – 3356 – 3352 – 3348 – 3344 – 3340
4️⃣ SELL ZONE
📌 Entry: 3376 – 3378
📌 SL: 3382
📌 TP: 3372 – 3368 – 3364 – 3360 – 3355 – 3350 – 3340
⚠️ RISK NOTE
CPI is a potential game-changer – even a small deviation from forecasts can trigger a massive one-way move.
Always keep an eye on AD-marked Key Levels on the chart before pulling the trigger.

GOLD ROUTE MAP UPDATEHey Everyone,
Great finish to the week with our chart idea playing out as analysed.
We complete dour Bullish target 3370 followed with cross and lock confirmation opening 3392 also completed this week. We now also have a cross and lock above 3392 opening 3416.
We will keep the above in mind when taking buys from dips. Our updated levels and weighted levels will allow us to track the movement down and then catch bounces up.
BULLISH TARGET
3370 - DONE
EMA5 CROSS AND LOCK ABOVE 3370 WILL OPEN THE FOLLOWING BULLISH TARGETS
3392 - DONE
EMA5 CROSS AND LOCK ABOVE 3392 WILL OPEN THE FOLLOWING BULLISH TARGET
3416
We will now come back Sunday with a full multi timeframe analysis to prepare for next week’s setups, including updated views on the higher timeframes, EMA alignments, and structure expectations going forward.
Thanks again for all your likes, comments, and follows.
Wishing you all a fantastic weekend!!
Mr Gold
GoldViewFX

Gold rises on continued central bank buyingHello everyone, great to see you again!
Gold prices have continued their upward momentum since last night, reaching as high as 3,403 USD, up 33 USD from the session’s low. At the time of writing, gold is undergoing a slight pullback but remains elevated around 3,385 USD.
The primary driver behind today’s rally is news that the People’s Bank of China (PBoC) continued accumulating gold in July, marking the ninth consecutive month of purchases.
Specifically, PBoC’s gold reserves increased by 60,000 ounces, bringing total holdings to 73.96 million ounces. Since November last year, China has purchased roughly 36 tonnes of gold in a move to diversify reserves and reduce reliance on the US dollar.
This trend of central bank gold buying, particularly by China, has been one of the key factors pushing gold prices up by 30% year-to-date, even though the pace has slowed as prices remain high.
With continued buying from central banks, gold is expected to maintain its upward trajectory, although a stronger US dollar could pose some headwinds.


Gold holds its bullish momentum - Strategy 1000 pips ? Hello everyone, what do you think about gold prices?
Yesterday, gold ended the session near the key psychological level of 3,400 USD. Overall, the metal remains in a short-term uptrend.
Some immediate supporting factors include:
-Concerns about the US economy – The Fed may soon have to cut interest rates, weakening the USD and making gold more attractive.
-Geopolitical uncertainty – Trade tensions between the US and India over Russian oil imports are prompting investors to turn to gold.
-Financial market volatility – Global equities show signs of a pullback after a strong rally, driving defensive capital flows into gold to reduce portfolio risk.
From a technical perspective: XAUUSD is maintaining a steady upward trend after breaking out of its previous down channel and forming a Rising Wedge pattern. On the chart, prices are consistently creating higher highs and higher lows, with the range narrowing over time — a sign that the market is consolidating before a potential breakout.
Currently, the lower boundary of the wedge is acting as support. If prices hold above this level, the primary scenario remains a move higher toward the 3,433 to 3,450 USD resistance zone. Conversely, if the wedge’s support is broken, the price could retrace to 3,350 USD before the uptrend resumes.
And you — what’s your view on XAUUSD’s next move? Share your thoughts in the comments!


Gold Continues Strong Bullish Move Hello everyone, wishing you a great trading day!
After a sharp decline from the recent highs, OANDA:XAUUSD quickly regained its strength and established a clear upward trend. The H4 chart shows the potential formation of a new upward trendline, with support positioned around the 3,350 USD zone.
This recent recovery is not just a technical bounce – it's supported by strong fundamental factors: weakening US bond yields, rising expectations that the Fed will cut interest rates in September, and a market sentiment that’s leaning towards safe-haven assets.
Currently, gold is trading around 3,380 USD and seems to be consolidating the momentum to approach the next resistance level at 3,433 USD. If the price holds above the new trendline and doesn’t break the marked support, the continuation of the upward trend is highly likely.
Personal view: The bullish trend remains intact – just a breakout confirmation and the 3,433 USD target will be within reach.
What do you think? Will gold continue its breakout this week? Leave your thoughts in the comments below!

Gold price continues to increase above 3400, next week✍️ NOVA hello everyone, Let's comment on gold price next week from 08/11/2025 - 08/15/2025
⭐️GOLDEN INFORMATION:
Spot gold held steady on Friday, while futures surged to a record high of $3,534 following reports that the United States will impose tariffs on imported gold bars. Traders also continued to digest recent U.S. economic data as they looked ahead to next week’s key inflation release. XAU/USD last traded near $3,397, little changed on the day.
Overnight, the price spread between New York COMEX futures and spot prices widened by more than $100, Reuters reported, after the Financial Times revealed that the U.S. had levied tariffs on one-kilo gold bars, citing a letter from U.S. Customs & Border Protection.
⭐️Personal comments NOVA:
Gold price accumulates around 3400, buying power remains good as interest rate cut expectations approach
🔥 Technically:
Based on the resistance and support areas of the gold price according to the H4 frame, NOVA identifies the important key areas as follows:
Resistance: $3418, $3437, $3500
Support: $3344, $3310
🔥 NOTE:
Note: Nova wishes traders to manage their capital well
- take the number of lots that match your capital
- Takeprofit equal to 4-6% of capital account
- Stoplose equal to 2-3% of capital account
- The winner is the one who sticks with the market the longest

GOLD (XAUUSD): Bullish Price Action after BreakoutFollowing a breakout of a significant horizontal resistance, 📈Gold retested this level and formed an ascending triangle on the 4-hour chart.
A bullish breakout above its neckline serves as a crucial intraday confirmation of strength of the buyers, suggesting a potential rise to at least 3430 support level.

XAUUSD: Triangle Completion Hints at Breakout PotentialOn the 1H timeframe, gold (XAUUSD) is moving within a narrow ascending channel and has recently formed a clear contracting triangle correction pattern (ABCDE). This structure suggests the market is consolidating before a potential breakout to the upside.
Detailed Analysis:
- Elliott Wave Structure:
Price action appears to have completed an ABCDE triangle, a common ending pattern before a breakout wave begins.
The conclusion of wave E implies a possible impulsive move is about to start in the direction of the prior trend – in this case, bullish.
- Trendline & Channel:
Price continues to respect a well-defined ascending channel formed since August 1st, indicating a sustained bullish structure.
The current price (3,398 USD) is nearing the upper boundary of this channel. A successful breakout could push price toward the 3,410–3,415 resistance area.
- Fibonacci Retracement:
The previous correction found solid support around the 0.618 Fibonacci level (~3,360 USD), which serves as a key buy zone if price retraces.
This area is ideal for a buy-the-dip opportunity in case of a pullback.
- EMA & RSI Indicators:
Price remains above the 50-period EMA, supporting the bullish bias.
RSI is trending above 50 and not yet in overbought territory, suggesting momentum still favors the bulls.
Key Support and Resistance Levels:
3,415 – 3,420: Major Resistance -Previous swing high, profit-taking zone
3,400 – 3,405: Minor Resistance - Channel top, potential breakout trigger
3,360 – 3,365: Key Support - Fib 0.618 zone, watch for bullish reaction
3,330
Deep Support
Strong demand zone from H4 chart
Suggested Trading Strategies:
- Strategy 1 – Breakout Buy:
Entry: On confirmed breakout above 3,405 with strong volume.
SL: Below 3,390
TP1: 3,415 | TP2: 3,420+
- Strategy 2 – Buy the Dip:
Entry: On pullback to 3,360–3,365 support zone.
SL: Below 3,350
TP: Return to 3,405–3,415 zone
- Risk Note: Price is currently near resistance – avoid chasing at the top of the channel. Only enter after breakout confirmation or wait for a retest of support for better R:R setups.
Conclusion:
Gold is showing strong potential for a bullish breakout following the completion of a classic triangle correction pattern. Focus on price action around the 3,400 level for intraday trading opportunities.

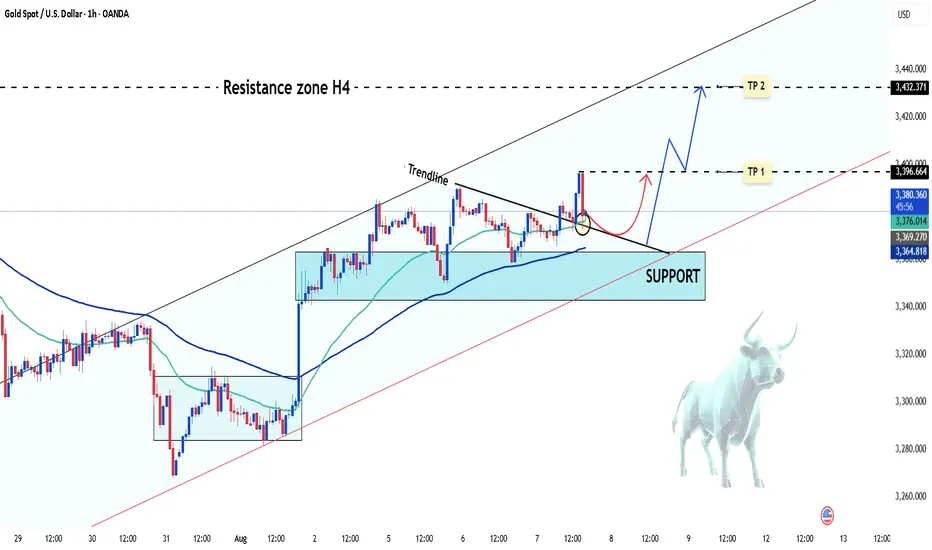
XAU/USD Short-Term Buy Opportunity ? XAU/USD has recently formed a bullish pattern, currently trading around 3,380 USD and showing an increase of more than 10 USD for the day.
From a technical analysis perspective, the price is following an upward trendline and showing signs of momentum accumulation. The area around 3,350 USD provides strong support, which could establish a solid base for further upward movement.
Key Levels:
Resistance (Target 1): 3,396 USD
Resistance (Target 2): 3,432 USD
To consider a short-term buy, it’s important to monitor price action around the support levels and wait for confirmation t
Good luck!