Gold Reversal in Progress - Sell Signal Confirmed Below 3375Hello IGT FOLLOWERS
Here is my Gold overview, Gold is showing weakness after rejecting resistance near 3378/3390. Price is giving rejection from the resistance level again and again, indicating bearish momentum. A break below 3360 could confirm further downside till 3330..
Key points :
Entry point : 3375
Resistance area : 3378/3390
Support Area : 3338/3330
Follow me for more latest updates and signals
GOLDCFD trade ideas


GOLD WEEKLY CHART MID/LONG TERM ROUTE MAPHey Everyone,
Weekly Chart Update – Another Clean Rejection + Bounce: Range Still in Play
Just a quick follow up on the ongoing weekly structure. We continue to see incredible respect for levels, with price action playing out exactly as mapped.
After the initial rejection at 3387, we got another test of support at 3281, and once again, the level held perfectly, delivering a clean rejection and bounce. Price is now rotating back upward, currently heading toward 3387, which remains the upside magnet and still open for a retest.
We remain firmly inside the 3281–3387 range, and as long as neither boundary breaks with confirmation, the structure remains our dominant guide.
Updated Structural Notes:
🔹 3281 Rejected Again
Support doing its job to the pip. This latest bounce further reinforces the strength of this level within the weekly channel.
🔹 Back Toward 3387
With 3281 holding once more, price is now tracking toward the 3387 resistance zone, which remains the key level to break for further upside continuation.
🔹 Channel Structure Unchanged
No breakdown below support, no confirmed breakout above resistance. The rising channel remains fully respected, and EMA5 still leans constructive.
Updated Levels to Watch:
📉 Support – 3281
Key weekly pivot tested and held again. Continues to offer solid dip buy opportunities unless decisively broken.
📈 Resistance – 3387
Still our major resistance. It’s been tested and rejected, but remains open for another challenge.
📈 Resistance 2 – 3482
Unfilled gap and broader weekly target. Only comes into focus if we get a proper breakout and hold above 3387.
Plan:
We stay range focused between 3281 and 3387 until proven otherwise. No breakout = no change. Watch for signs of momentum as we approach the top again a confirmed close above could shift the game toward 3482. Until then, structure is king.
Appreciate all the continued support.
Mr Gold
GoldViewFX

XAUUSD Bearish SMC Analysis – Institutional RejectionXAUUSD Bearish SMC Analysis – Institutional Rejection from Supply Zone
Gold (XAUUSD) is showing a clear bearish structure after rejecting a major supply zone at premium pricing. This setup is aligned with Smart Money Concepts (SMC) and reflects how institutions manipulate liquidity and order flow before major price moves.
🔍 Market Structure Context:
The market had been trending upward with higher highs and higher lows, until it approached a key premium supply zone near $3,420.
At this level, price stalled, creating internal Equal Highs (liquidity) — a common trap used by institutions to grab orders before reversing.
🔄 Change of Character (CHoCH):
A clear CHoCH was printed when price broke below the most recent higher low, signaling a shift from bullish to bearish structure.
This change marked the first early signal that institutional order flow has flipped bearish, and distribution is underway.
📉 Break of Structure (BOS):
Following the CHoCH, the market confirmed intent with a clean BOS to the downside.
This structural break confirms bearish control and validates short bias.
🧲 Liquidity Engineering:
Equal Highs were swept at the top, indicating a liquidity grab before institutions drove price downward.
This move traps breakout buyers and provides large players with sell-side execution at premium pricing.
🧱 Fair Value Gap (FVG) & Supply Zone Mitigation:
After BOS, price retraced into a Bearish Fair Value Gap (FVG) and the origin of the supply zone, offering a high-probability entry.
The rejection from this zone showed imbalance was respected and no bullish continuation existed — further validating the short setup.
🔍 Confluences for the Bearish Bias:
Confluence Confirmation
CHoCH Structure flipped bearish
BOS Bearish continuation confirmed
Liquidity Sweep Equal highs taken
FVG Retest Smart Money re-entry signal
Supply Zone Mitigation Institutional reaction confirmed
📘 Educational Summary:
This setup exemplifies a complete Smart Money bearish reversal model:
Premium pricing ✅
Liquidity taken ✅
Structure flipped (CHoCH + BOS) ✅
Supply & FVG respected ✅
It reflects how institutions build positions quietly, using engineered liquidity to trap retail traders, and then drive price with high-volume imbalance moves.


Only look for BUY signal points in the current trend of Gold✏️The D1 candle closed with strong bullish force at the end of the day. The gold trend is still increasing wave 3 and there is no sign of correction. The reaction around 3385 in the Asian session this morning is being awaited to see if it is a recovery of Gold or not. The BUY strategy at important support zones is still maintained and pay attention to the price reaction of the candle.
📉 Key Levels
Support 3363-3346-3332
Resistance 3385 - 3407
Buy trigger: Confirmation of buying candle at support zones 3363-3346-3333
Target: 3400.00

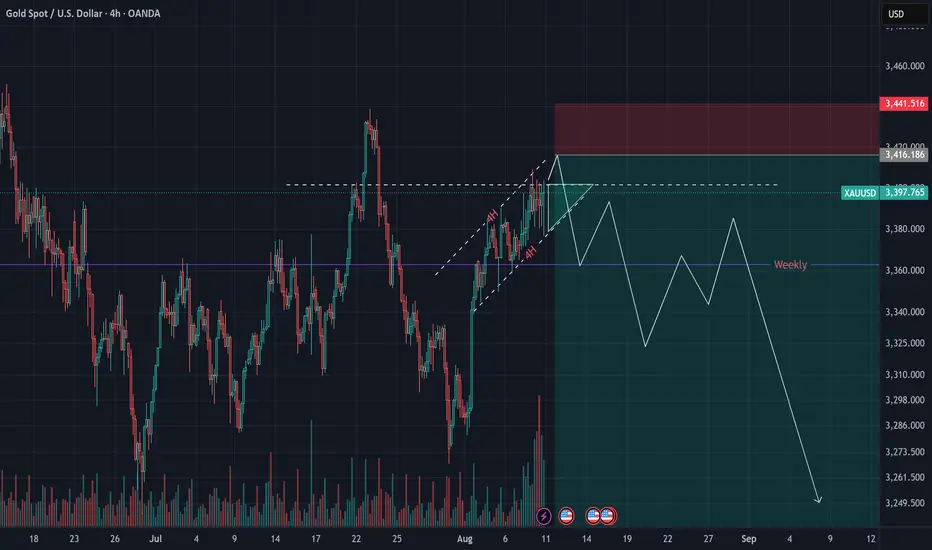
Gold Market Weekly Outlook📊 Gold market opens ahead of weekly candle formation, sweeping through imbalance at the 3360’s. The weekly stance remains bullish, with momentum building toward a potential break of the 3420’s supply zone.
🟡 Key Watch Points:
Imbalance Cleared: 3360’s
Weekly Target: 3420’s
Bias: Bullish continuation if price holds above 3360’s

Gold (XAU/USD) Analysis – August 10, 2025We’ve been waiting for gold to break above the 3400 level for quite some time.
Despite multiple tests and deep wicks into this zone,
I don’t expect the coming week to bring a fresh high for gold.
With price compression between 3390 – 3400,
I anticipate that the market will be selling gold this week.
We should also expect a stop hunt on sellers before the drop.
My preferred short entry zone remains 3415 – 3430,
with a probable target around 3200,
making this risk-reward setup attractive.
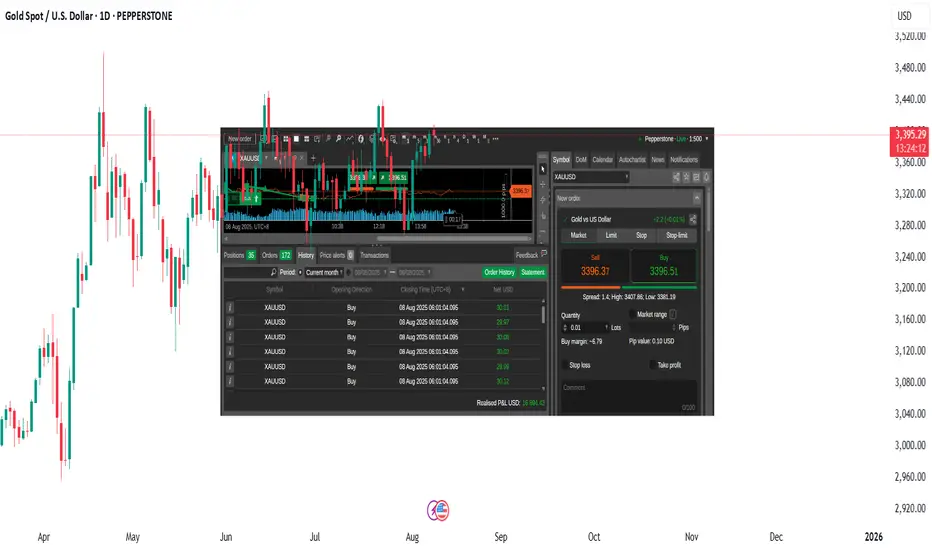
Up 16K USD Profit For The Month On XAUUSD Momentum TradingXAUUSD is again making these ranges as it goes up. If you can identify these ranges then you can do a short trade on the resistance levels and a long trade on support levels. XAUUSD is trending up overall but if you are a trend-follower then you will have a hard time timing your entries just because of the ranges XAUUSD is making. It will go up to 3,400 then go back down to 3380 then back again to 3,400 then down again to 3375. Momentum trading is the best approach. You short the tops. Go long on bottoms. Get in, get out. I currently have 16,894 usd realized profit on XAUUSD this month doing momentum trading. I'm trading a live account. FED will probably cut rate soon and there will be a lot of bullish predictions on XAUUSD but I highly suggest to just trade the chart. Do not have any opinion on where the market or the price will go. Let the price move and just react. No one can predict the market. Trade your chart. May you trade well.

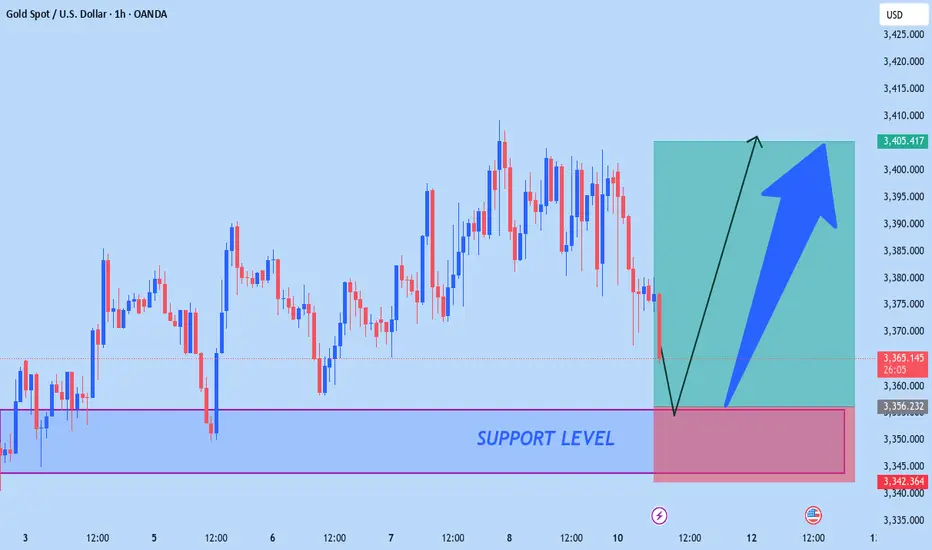
XAUUSD CAN FLY HIGHAccording to H1 analysis Gold market is in falling pressure from morning so wait for good opportunity market will be back from SUPPORT LEVEL if you want to go LONG position then go from SUPPORT LEVEL it is best for you use proper money management
TRADE AT YOUR OWN RISK
REGARD ALBERT

Gold (XAU/USD) Technical Analysis – August 11, 2025📊 Gold (XAU/USD) Technical Analysis – August 11, 2025
As anticipated in my previous analysis, gold dropped precisely from the midline of the channel and the descending trendline, showing a strong bearish rejection. Currently, the price is hovering near the $3,338 support.
🔹 Bullish Scenario:
If this support holds and we see strong bullish confirmation candles, gold could start a rebound. The first upside target is $3,359, followed by $3,370 and $3,375, which aligns with the broken ascending pink trendline, suggesting a potential pullback retest. If this level is broken, the next target will be the descending blue trendline.
🔹 Bearish Scenario:
If the $3,338 support breaks, the next key level to watch is $3,332, followed by $3,312 and finally the channel bottom support.
📌 Summary:
Gold is now at a critical decision point. Watch for confirmation signals at $3,338 to determine whether we get a bullish pullback or further downside movement.

XAU/USD (Gold) - Triangle Breakout (1.08.2025)The XAU/USD Pair on the M30 timeframe presents a Potential Selling Opportunity due to a recent Formation of a Triangle Breakout Pattern. This suggests a shift in momentum towards the downside in the coming hours.
Possible Short Trade:
Entry: Consider Entering A Short Position around Trendline Of The Pattern.
Target Levels:
1st Support – 3249
2nd Support – 3225
🎁 Please hit the like button and
🎁 Leave a comment to support for My Post !
Your likes and comments are incredibly motivating and will encourage me to share more analysis with you.
Best Regards, KABHI_TA_TRADING
Thank you.
Disclosure: I am part of Trade Nation's Influencer program and receive a monthly fee for using their TradingView charts in my analysis.

Strike with precision and win in the gold trading market!Gold continues to fluctuate in an upward structure, with lows gradually rising, showing that the bulls are still in a dominant position. The current key support has moved up to the 3360 line. Before this position is effectively broken, the overall idea is to maintain a low-long strategy. It should be noted that the current market has been consolidating at a high level for three consecutive days, and has the basis for further strengthening. It is not advisable to wait for a sharp pullback at this time, but to pay attention to the continuity opportunities of direct pull-ups. It is recommended to seize the strong continuation opportunities in the current period in terms of operations, and strategically postpone it to the European and American trading sessions for simultaneous execution. Specifically pay attention to the long order layout opportunities in the support area of 3375-3360, and the upper resistance is around 3390-3405. Overall, we should flexibly participate in the high-altitude and low-long rhythm in this range. It is recommended to wait and see in the middle position, chase orders cautiously, and wait patiently for key points to enter the market.

The best ambush point for short positions below gold 3400.The daily structure of gold still maintains a bullish dominant pattern. The upper target is the upper Bollinger band of 3400. If it breaks through this position, the upside space will be further opened up. The 4-hour Bollinger band is gradually closing, and the price is fluctuating in the range of 3400-3360. In the short term, it is still treated with range thinking. Before an effective breakthrough, the operation can adopt a high-altitude and low-long strategy. Gold is currently at a critical node of change. If it rises and falls in the evening, it may release a temporary peak signal. The area below 3400 is expected to become an opportunity for the layout of medium-term short positions. The overall recommendation is to remain cautious, respond flexibly to changes in rhythm, and strictly control risks.
Gold operation suggestion: You can continue to try short selling in the 3390-3400 range, with the target at 3380-3370.

GOLD Short tradeOANDA:XAUUSD Short trade, with my back testing of this strategy, Short correction.
This is good trade.
Don't overload your risk like Greedy Gambler!!!
Be disciplined trader.
Use proper risk management
Looks like good trade.
Lets monitor.
Use proper risk management.
Disclaimer: only idea, not advice

Grasp the trend accurately and have a crazy weekend!After testing the 3380 support level several times in a row today, gold maintained an oscillating upward trend. Today's layout of 3380 repeatedly went long, and 3400 shorts were all successfully closed with profits, with a total profit of 580pips. Currently, gold is oscillating at a high level in the 3404-3380 range. The possibility of a direction choice cannot be ruled out in the evening. If the market continues to be bullish in the evening, it is necessary to pay attention to whether the price will fall below 3380 when it tests the support level for the third time. If the support level is effectively broken, it is expected to fall to the key support level of 3370. If the price firmly stands above the 3400 mark, it may continue to test 3410. If there is no breakthrough either above or below, it will still maintain a range of oscillations, and the idea of selling high and buying low will be the main focus.

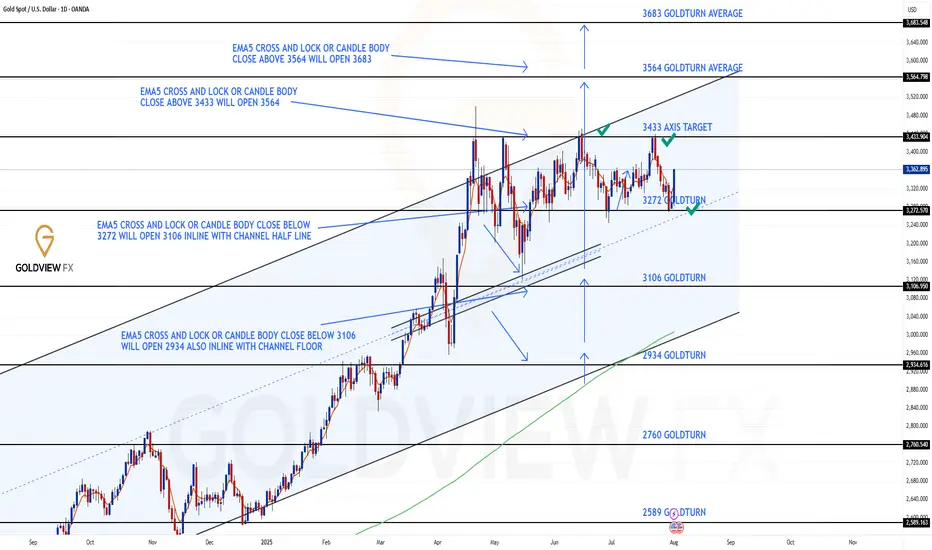
GOLD DAILY CHART ROUTE MAPHey Everyone,
Daily Chart Update – Another Clean Rejection: Structure Still Dominates
Following up on the recent price action last week after hitting the 3433 resistance level, we got exactly what the chart warned us about.
There was no confirmed break above 3433, which led to a clean rejection right back into 3272. Interestingly, the move aligned perfectly with the channel half-line, giving us another bounce right off that zone.
We remain in the same structured range, with price still rotating between 3262 and 3433, a 170+ pip zone that continues to deliver high probability trade setups.
Here’s where we are now:
🔹 Range Still Active
Price is respecting the 3272–3433 boundaries with precision. Until we get a decisive break and hold outside this range, range bound strategies remain in play.
🔹 No Breakout = Clean Rejection
The failure to sustain above 3433 confirms resistance is still valid. We're watching EMA5 for potential breakout confirmation, until then, the bias stays neutral within the range.
🔹 Channel Half-line Bounce
That rejection into 3272 also matched the channel half-line and the bounce there further cements this area as critical support.
Updated Key Levels
📉 Support – 3272
Still the major pivot. Buy zones remain valid here unless we see a confirmed breakdown.
📈 Resistance – 3433
Now clearly tested and rejected again. Any clean break and hold above could change the dynamic, but until then, it's solid resistance.
Thanks as always for your support.
Mr Gold
GoldViewFX

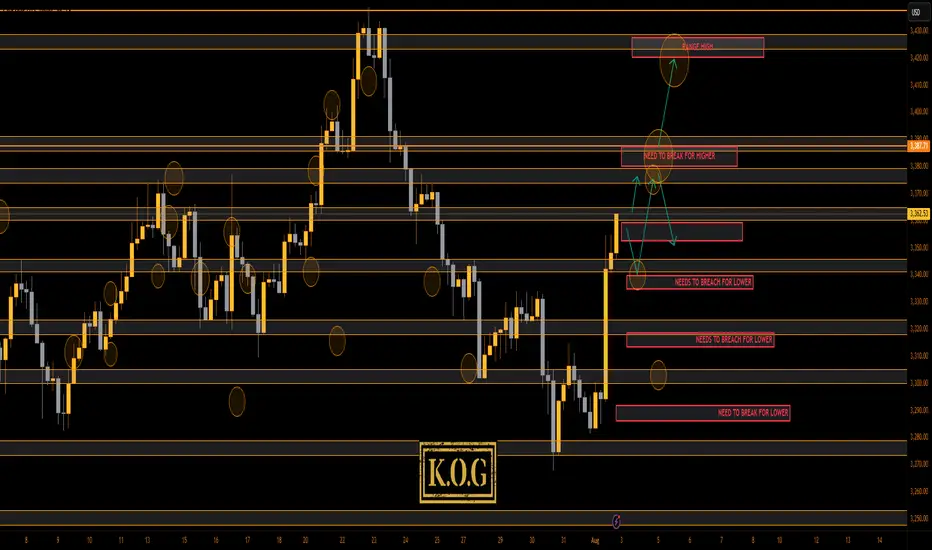
THE KOG REPORT THE KOG REPORT:
Due to there being no KOG Report last week so we won’t reference it, however, we did post the FOMC and NFP reports for the wider community to help them navigate the moves, which as you can see from the pinned ideas worked well.
So, what can we expect in the week ahead?
After the move we observed for NFP on Friday we would like to see some retracement in the sessions ahead. Looking at the 4H chart we have a reversal in play, but we still have no break out of this range! We’re simply playing the highs and the lows while price chops and whipsaws within it, which could be causing some new traders confusion and frustration.
We have a support level below 3350 and below that 3340 which will be the bias level for this week as bullish above. We then have the intra-day resistance level 3365-70 while there is an extension of the move into the 3385 level. Ideally, what we want to see here is support levels hold or a quick continuation on the open into the higher red box levels and the a potential for a RIP. That RIP however is most likely going to be a scalp unless we come down and break below that 3345-50 level.
We want to see how this reacts at these higher levels and if we do get a break of the boxes, otherwise, there is a chance we see another curveball like we suggested a couple of weeks ago, and we correct this whole move back downside with the first hurdle being 3340-35 on the flip.
We’re going to keep it simple here for now and usual we’ll update during the week once we have a clearer understanding of whether this wants to attempt a new all time high or not.
Please note, our liquidity indicator is suggesting a little higher but a pullback is on the way.
We’ll keep you updated.
KOG’s bias for the week:
Bullish above 3340 with targets above 3370, 3373, 3379 and above that 3384
Bearish on break of 3340 with targets below 3330, 3320 and below that 3310
RED BOXES:
Break above 3365 for 3372, 3375, 3379, 3384 and 3390 in extension of the move
Break below 3350 for 3346, 3340, 3335 and 3330 in extension of the move
Please do support us by hitting the like button, leaving a comment, and giving us a follow. We’ve been doing this for a long time now providing traders with in-depth free analysis on Gold, so your likes and comments are very much appreciated.
As always, trade safe.
KOG
XAUUSD: Adjustment Phase and Future OutlookHello everyone, today let's analyze the current movements of XAUUSD.
Currently, gold has gone through a period of adjustment, as the bulls were unable to push the price above the 3,400 USD level. Market instability has caused gold to pause its upward trend and enter a liquidation phase.
This adjustment reflects a cautious sentiment from investors in Asia. The 3,400 USD level remains a significant barrier, and this has become even clearer with factors such as weak data from China (PPI -3.6%) and uncertainties surrounding US-China trade talks putting pressure on gold's price. Additionally, expectations regarding the US inflation report and uncertainty in the semiconductor policy are hindering gold’s upward momentum. These factors reduce gold’s appeal as a safe-haven asset.
The key focus now is the trading range between 3,400 and 3,350 USD. Before further upward movement, the market may need to test this support level again.
We are now witnessing a retest of 3,358 USD with a false breakout, and the market’s response at this level is relatively weak. In the short term, gold may continue to adjust towards 3,350-3,345 USD. However, if the bulls can maintain the price above this level, a recovery seems a plausible scenario.
What are your thoughts on gold’s ability to maintain above the current support level? Could the market soon rebound and resume its upward trend?
