GOLDCFD trade ideas

GOLD, Will the correction continue or not ??Hello Traders, Hope you are doing great.
As you can see below this post, We expected a correction in GOLD yesterday because it was forming a Rising Wedge Reversal pattern. The price corrected about 500 pips and then it began to retrace to 61.8 Fibo level. But what happens now? will the correction continue or not ?
The answer of this question is a Hesitant Yes, it will probably continue its downward correction, but PCE data that comes Friday can change everything, so Don't forget to use proper risk management. and Remember that these kind of corrections are temporary and gold price will probably see higher price this year
and finally tell me What are your thoughts about GOLD ? UP or DOWN ? comment your opinion below this post.

XAUUSD(Gold) FORECAST (Must Read Caption)Hello Friends Check out my XAUUSD(Gold) Forecast and share your thoughts about it .
28th February 2025 Friday.
📈 XAUUSD ( Gold) Looking Bearish now Gold had Breaks its major Resistance levels ,Gold can Further Declines Other Support levels which I have Identified ✅️
📊 According to My Previous Chart Gold will Falls it's already hit So Let's Foucs on The Same View in Bearish Side
✅️ Key Highlights are.
✅️Support Zone 2842.
✅️Retracement Zone . 2870
🎯 Target Area . 2822-23
Support me With Your Likes & Comments to Motivate me to share more Analysis with you.

Gold, XAUUSD Head & Shoulder Formation In ProcessGold Intraday/Short term charts are developing a pattern head & shoulder that suggest a thing sideways/limited upside view can play its part with support 2890-2885 that can act as thresh hold for bulls/bears. Bears may try to break and open 2846-2841 while bulls like to hold the prices above.
See who would win but I think we may have some sell opportunity around 2942/2947 if failed the counter level to sell would be around 2966/2867.
I am not setting any goal as today and would act accordingly upon testing my calculated support/resistance ranges zones to trade for some quick profits.
Feedback is highly appreciated.

Gold is waiting to break new highs, and the callback in late traFrom a technical perspective, the current upper 2924-2930 range has become a resistance zone for further increases in gold prices. The stability of the market bottom shape and the overall stronger trend in late trading indicate that gold prices are expected to break through this resistance in the future and set a new intraday high. At the same time, the 2912-2907 area below provides solid support for gold prices and provides a strong guarantee for the continuation of the bullish trend. Therefore, in the late trading operation, we recommend that investors mainly go long on callbacks.
Late trading operation strategy 1: It is recommended to go long in the 2918-2913 area, stop loss at 2907, and the target is 2930-2940.

GOLD (XAUUSD): Classic Bearish SetupI think that 📉Gold has the potential to continue falling.
The market has been consolidating in a wide horizontal range for some time on an intraday chart.
Breaking below the support level is a strong signal of bearish momentum.
The pair is currently testing the previously broken support level.
I anticipate that the price could potentially fall to the 2840 support level.

Gold is about to see a waterfallToday's short-term gold operation ideas suggest that callbacks should be the main focus, and rebound shorts should be supplemented. The upper short-term focus is on the 2940-2942 first-line resistance, and the lower short-term focus is on the 2906-2910 first-line support. All friends must keep up with the rhythm. It is necessary to control the position and stop loss, set stop loss strictly, and do not resist single operation. The specific points are based on intraday real-time
Short order strategy:
Strategy 1: Short 20% of the gold position in batches when it rebounds to around 2940-2942, stop loss 6 points, target around 2930-2920, break to see 2910 line;
Long order strategy:
Strategy 2: Long 20% of the gold position in batches when it pulls back to around 2908-2910, stop loss 6 points, target around 2920-2930, break to see 2940 line;

Can gold break through the high-level fluctuations?Gold technical analysis: Yesterday, the gold price fluctuated and rebounded all the way. Today's early trading is close to the historical high of 2940 again. So can it successfully break through 2940 and set a new historical high again? The more times a position is tested, the greater the probability of breaking. Therefore, the probability of gold prices reaching a new high is very high.
At present, the support below is mainly in the 2915-2910 area. In addition, we also know that last year’s market also tested retracements near consecutive historical highs. Then there was a retracement near 2940 on Friday last week. Today’s 2940 retracement. I don’t know if 2940 will continue to suppress the retracement in the future. But you can still try a short-term short near 2940. After all, the cost-effectiveness of the retreat here is very high. The defense is very small. The short-term retreat is considerable. Of course, this is an aggressive approach. If you are prudent, wait for the gold price to rise and then participate in the retreat. At present, the author only sees the pressure of 2955. Therefore, if it hits the 2955 line, you can do a good job of risk control and participate in the retreat.
On the whole, today's short-term operation of gold recommends mainly shorting on rebounds, supplemented by longs on callbacks. The top short-term focus is on the 2940-2942 first-line resistance, and the bottom short-term focus is on the 2905-2900 first-line support.
Short order strategy:
Strategy 1: Short 20% of the gold position in batches when it rebounds to around 2940-2942, stop loss 6 points, target around 2930-2920, break to see 2910 line;
Long order strategy:
Strategy 2: Long 20% of the gold position in batches when it pulls back to around 2906-2910, stop loss 6 points, target around 2920-2930, break to see 2940 line;

Gold 1H Intra-Day Chart 03.03.2025As it's a new monthly candle, Gold needs some upside LQ before it can carry on dropping. Right now my bias is;
Option 1: Gold pushes higher, from current market price towards $2,900.
Option 2: Gold drops a little lower towards $2,856 zone before rejecting and buyers step in again.

Gold Swing Trading PlanFrom the trend point of view. Comparing the long and short positions, the shorts are still slightly stronger, with the upper resistance of 2930-2935. At present, the gold price fluctuates in a narrow range around 2920. There is no major news to boost or suppress the gold price in the short term. From the trend point of view, it is obvious that the rebound of gold is not enough to support the rebound and continuation of the breakthrough of gold. Therefore, after consuming a certain amount of long power, the shorts will regain control of the situation, and there will be very good trading opportunities for shorting gold. Now we have shorted gold around 2020-2930. The target is 2915-2905 area, wish us good luck! Brothers, have you followed me to short gold?
Want to expand profits but not expand profits, unclear about the direction, and don’t know how to analyze the market. If you are the same. Then you can try to change your trading style with a fast trading strategy. If you are interested, you can join my bottom article.

First go long gold, then go short goldThe current international gold price shows a typical head and shoulders bottom reversal pattern, with 2900-2905 below being the key support area for gold. From a technical perspective, it shows that gold has accumulated reversal momentum at the bottom after falling, and the release of ADP employment data may promote the accelerated rise of gold prices. Then the resistance above gold will first focus on the suppression of the 2930 line. If gold breaks through 2930, then we can test the key resistance area of 2945-2955, the historical high.
Therefore, in short-term trading, I advocate going long gold. When gold falls back to around the 2910-2900 area, we can go long gold.
In fact, as long as you grasp the rhythm, it is easy to profit from gold trading. If you don't know the accurate trading rhythm, you can follow my trading ideas. I post my trading ideas every day and I also post free trading signals on a regular basis. Many friends have given feedback that it is very helpful. If you want to learn market trading logic, or you want clear trading signals and make more profits, I can satisfy you. Follow the bottom of the article to enter for details!

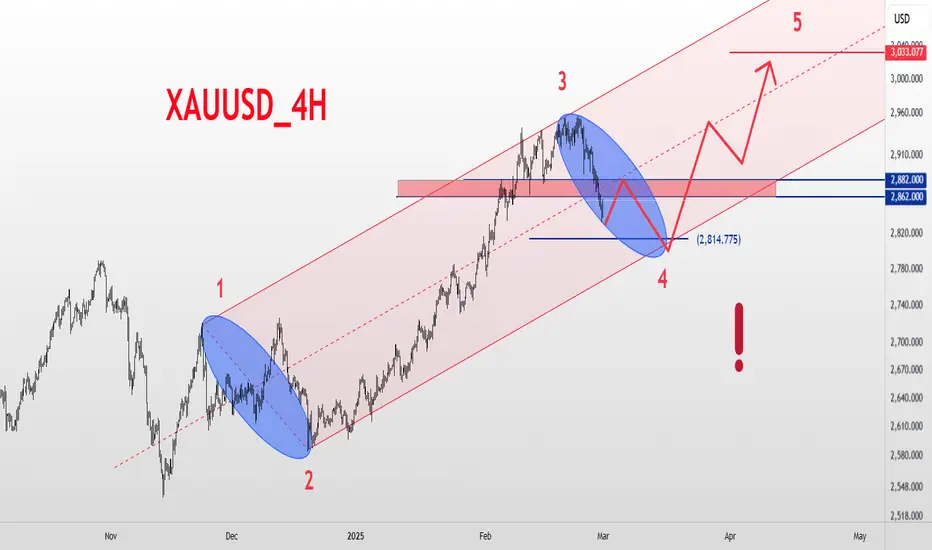
XAUUSD Weekly Analysis – Gold in Correction or Bullish Move? Gold (XAUUSD) Weekly Update:
Gold has entered a correction phase after showing divergence. Based on Elliott Wave, Wave 3 has ended, and we're now in Wave 4. If 2800 holds, the main trend stays bullish, and after this correction, Wave 5 could push us towards $3000! 💰
Key Levels:
Support: 2800
Resistance: 2862 – 2882
As long as price stays below the 2862-2882 range, the trend is bearish short-term. A break above could signal a bullish continuation. 📈
What’s your take on gold? Will we see $3000 soon? Drop your thoughts below! 👇
#XAUUSD #Gold #GoldAnalysis #XAU #TechnicalAnalysis #Trading #ElliottWave #Forex #Investing #GoldPrice


If rejection happens again at $2,920, expect a drop to $2,892📊 Deep Real-Time Analysis of XAU/USD (15m Chart)
🔥 March 5, 2025 – Market Structure, Candlestick Pattern & Trade Decision
📌 Key Observations From Your Chart:
1️⃣ Price Action & Market Structure
✔ Price is consolidating between $2,910 - $2,920 (red box) → This is a tight range, signaling potential breakout or breakdown.
✔ Multiple wicks rejecting $2,920 → Indicates strong resistance at this level.
✔ Higher lows forming → Suggests bullish accumulation, but price needs to break above $2,920 - $2,926 for confirmation.
2️⃣ Support & Resistance Levels
🔹 Strong Institutional Support:
$2,910 → Minor liquidity zone (held multiple times).
$2,900 - $2,902 → Strong institutional demand.
$2,890 - $2,892 → Next key institutional support.
🔸 Major Institutional Resistance:
$2,920 - $2,926 → Immediate breakout level.
$2,930 - $2,950 → Strong supply zone.
📉 Candlestick Pattern Analysis (Last 5 Candles - 15m Chart)
1️⃣ Candle #1 (Left-most)
Bearish rejection candle → Price tried to break above $2,920 but failed.
Wick on top suggests selling pressure.
2️⃣ Candle #2
Indecision Doji → Shows hesitation between buyers and sellers.
Market is waiting for confirmation.
3️⃣ Candle #3
Bullish engulfing candle → Indicates some buyers stepping in.
Failed to close above $2,920, which is a warning.
4️⃣ Candle #4
Weak bullish candle → Lower wick shows buyers are defending $2,910, but strength is lacking.
5️⃣ Current Candle (Live)
Attempting to push up but still under resistance.
If this candle closes strong above $2,920, bullish breakout likely.
If rejection happens again at $2,920, expect a drop to $2,900 or lower.
📢 Trade Decision – Should You Buy or Sell?
📍 Best Trade Setup Based on Current Data
✅ Buy Setup (ONLY IF Breaks Above $2,920)
📍 Entry: Buy at $2,921 - $2,922 (Breakout Entry)
🎯 Target:
TP1: $2,926
TP2: $2,930
TP3: $2,950
❌ Stop-Loss: $2,910 (Below current structure).
❗ DO NOT Buy Yet – Wait for a Clean Break Above $2,920.
🚨 Short Setup (Higher Probability Trade Right Now)
🔻 Short XAU/USD Now at $2,918 - $2,920 (Sell on Rejection)
📍 Entry: $2,918 - $2,920 (Sell if price rejects this zone again)
🎯 Target:
TP1: $2,910
TP2: $2,900
TP3: $2,892
❌ Stop-Loss: Above $2,926 (Invalidates short thesis).
🔥 Final Verdict – Sell Now or Buy Later?
📌 Best Trade Right Now: SHORT XAU/USD at $2,918 - $2,920.
📌 Only Buy if price breaks and closes above $2,921.
💰 Execute with confidence & monitor order flow for confirmation! 📊🔥


XAU/USD 05 March 2025 Intraday AnalysisH4 Analysis:
-> Swing: Bullish.
-> Internal: Bearish.
Price has printed a bullish CHoCH according to analysis and bias dated 28 February 2025.
Price is currently trading within an established internal range.
Intraday Expectation:
Price is now trading in premium of 50% internal EQ where we could see a reaction at any point. Price could also target H4 supply zone before targeting weak internal low, priced at 2,832.720
Note:
With the Federal Reserve's dovish stance and persisting geopolitical uncertainties, heightened volatility in Gold is expected to continue. Traders should proceed with caution and adjust risk management strategies in this high-volatility environment.
Price could also be driven by President Trump's policies, geopolitical moves and economic decisions which are sparking uncertainty.
H4 Chart:
M15 Analysis:
-> Swing: Bullish.
-> Internal: Bearish.
Analysis and bias remains the same as analysis dated 03 March 2023.
As mentioned in my analysis dated 28 February 2025, whereby price printed a bullish CHoCH but stated I would continue to monitor price.
On this occasion I have marked the previous bullish CHoCH in red as price did not pull back deeply enough to warrant internal structure breaks, additionally, there was minimal time spent .
Price has printed a further bullish CHoCH which is now confirmed. Price is not trading within an established internal range.
Intraday Expectation:
Price to continue bullish, react at either premium of internal 50% EQ, or M15 supply zone before targeting weak internal low priced at 2,832.720.
Note:
With the Federal Reserve maintaining a dovish stance and ongoing geopolitical tensions, volatility in Gold prices is expected to remain elevated. Traders should exercise caution, adjust risk management strategies, and stay prepared for potential price whipsaws in this high-volatility environment.
M15 Chart:

XAUUSD (GOLD) NEXT MOVE POSIBLE (READ CAPTION)Hello traders here is my (GOLD) Analysis chart please check and give your thoughts in comment section
(Gold) pivot piont is 2856 and the gold fully retest its all sell targets now its showing strong bullish trend. market now working in channel bullish trend and market rejected our support areas and make a bullish candle that indicate to strong bullish trend line.
key levels
bullish trend
buy target are
Target 1) 2875
Target 2) 2900
Demand zone 2920/2930
If you guys like my Analysis chart please dont forget like and comment for latest updates


XAUUSD Analysis todayHello traders, this is a complete multiple timeframe analysis of this pair. We see could find significant trading opportunities as per analysis upon price action confirmation we may take this trade. Smash the like button if you find value in this analysis and drop a comment if you have any questions or let me know which pair to cover in my next analysis.


