The idea remains unchanged, NY3360-3365 is emptyThe idea remains unchanged during the NY period. Although gold has currently reached a high of around 3348, it has not stabilized above it. If gold successfully breaks through 3350 in the short term, it may reach 3360 or 3365. In the 4H cycle, it presents a step-by-step upward pattern. The K-line is temporarily fluctuating sideways near the upper track. At the same time, 3345 has formed a double top pattern. Combined with Thursday's low of 3310, an inverted triangle oscillation range of 3345-3310 is formed in the short term. This week's trend needs to pay close attention to the breakthrough direction of this range. Short-term long positions can be taken after the trend is confirmed.
XAUUSD@3330-3320 long TP 3345-3365
OANDA:XAUUSD
GOLDCFD trade ideas

GOLD - 1H VIEWStill looking for a move lower in the coming weeks. There are 2 possible zones I would like to see Gold sell off from:
Zone 1: $3,356 - $3,340 (CMP)
Zone 2: $3,406 - $3,426
Being patient, with no current sells. This analysis is just my current theory. If $3,450 (Wave 2 high) is taken out, then we are heading towards $3,600+

Gold Opens at 3320’s — Bullish Momentum Eyes 3350’sGold market opens the week at 3320’s during the Asian Session, signaling a potential bullish momentum resurgence. Current sentiment aligns with a projected move towards the 3350’s, maintaining the bullish structure.follow for more insights , comment and boost idea


Gold Spot Price (USD) - 4-Hour Chart (OANDA)4-hour performance of the Gold Spot price against the U.S. Dollar (OANDA). The current price is $3,223.660, reflecting a 1.3% decrease. Key levels include a resistance zone around $3,360.405 and a support zone near $3,294.070, with recent price action showing a potential breakout or reversal within these ranges.

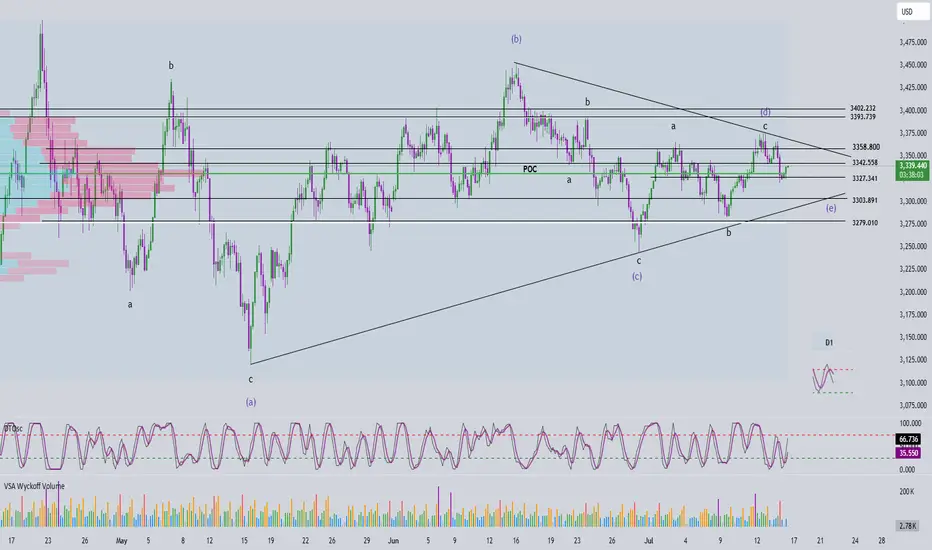
Elliott Wave Analysis – XAUUSD July 16, 2025🔄 Momentum Analysis
D1 timeframe: Momentum is currently reversing to the downside, suggesting that the price may continue to decline or move sideways in the short term.
H4 timeframe: Momentum is rising, indicating that the current recovery may continue. The next resistance zones to watch are 3342 and 3358.
🌀 Elliott Wave Structure
At present, price action is being compressed within a contracting triangle corrective pattern, with its range narrowing further—signaling market consolidation. We should closely monitor for signs of a breakout that could end this correction.
Based on the current wave structure, it is expected that wave d (green) has completed, and the current downward move is likely part of wave e (green).
The trading strategy focuses on waiting for the price to approach the lower boundary of the triangle—drawn from the low of wave a to the low of wave c—looking for confluent support areas near this trendline to identify a potential BUY opportunity.
🎯 Target & Trade Plan
BUY ZONE: 3303 – 3300
Stop Loss (SL): 3290
Take Profits (TP):
- TP1: 3327
- TP2: 3358
- TP3: 3402

GOLD: Absolute Price Collapse Ahead! Short!
My dear friends,
Today we will analyse GOLD together☺️
The price is near a wide key level
and the pair is approaching a significant decision level of 3.324.79 Therefore, a strong bearish reaction here could determine the next move down.We will watch for a confirmation candle, and then target the next key level of 3,317.96..Recommend Stop-loss is beyond the current level.
❤️Sending you lots of Love and Hugs❤️

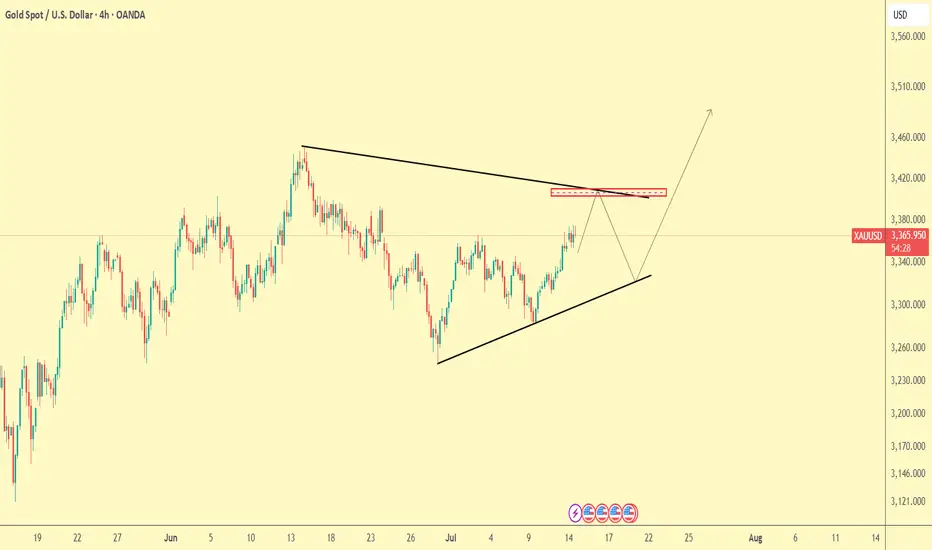
Gold Trade Plan 14/07/2025Dear Traders,
On the 4H chart, gold (XAUUSD) is forming a symmetrical triangle, with price approaching a key resistance zone (highlighted in red) around 3375 - 3385, which aligns with the descending trendline.
📍 Two possible scenarios:
Pullback scenario (more likely short-term):
Price gets rejected from the red box and pulls back to the ascending trendline below (~3300-3320).
Bullish breakout scenario:
If price breaks and holds above the red resistance and descending trendline, the next bullish target could be 3450 - 3470.
For now, the best strategy: Wait for price reaction at resistance before entering a trade.
Regards,
Alireza!
XAUUSD H4 Outlook – July 15, 2025After a sharp early-week move, gold is now pressing into H4 supply with clean CHoCHs and clear inducement in play. With CPI data and multiple FOMC speakers on deck, volatility is rising — and so are the opportunities. Let’s break down the current structure.
🔸 H4 Market Bias
Bias: Bearish unless we close firmly above 3420
Structure: Internal bearish flow remains → HL formed at 3210 → CHoCH → current move likely inducement
Context: Price has filled key FVGs and is testing unmitigated OBs in premium, with RSI approaching exhaustion
🔼 Zones Above Current Price:
3445–3465:
This is the weak high and final layer of buy-side liquidity. It includes an unfilled FVG and marks the upper limit of the premium range. If price reaches this zone, it’s likely to act as a trap before a deeper rejection.
3405–3420:
A clean imbalance zone left after the initial CHoCH push. It has already shown rejection once and is now positioned as the key area where a lower high could form. If price reacts here, it confirms continuation to the downside.
3360–3385:
This is the core supply OB, created from the CHoCH. It also aligns with the premium boundary and EMA21 resistance. Current price is already reacting here. Rejection confirms the bearish bias.
🔽 Zones Below Current Price:
3340–3355:
A minor wick-fill zone from past reactions. It may provide a small pause, but it’s structurally weak and more likely to break on momentum. Not a major support.
3300–3280:
This is the key intraday demand zone. It’s built from a previous BOS and sits at the 50% retracement of the last bullish leg. If this zone breaks, we open up deeper downside potential.
3240–3210:
The strongest demand OB on the chart. This is the HL origin and the 61.8% fib zone. If gold reaches here, expect a major decision: bounce or break.
3185–3160:
The final liquidity base under the higher low. If price sweeps this zone, it signals a major shift — potentially invalidating the June rally structure.
📊 Indicators & Flow Notes:
EMAs (5/21): Crossed bullishly, but testing overextension at 3360
RSI: Leaning overbought → potential for rejection at current zone
Volume: Bearish pressure expected if price fails to close above 3385
Fibonacci (last bullish leg): 50% sits at 3285; 61.8% near 3250
🧠 Trade Scenarios:
🔸 Bearish Setup (preferred):
→ Reject inside 3405–3420 → form LH under 3420 → clean drop toward 3300
→ Ideal confirmation = rejection wick or bearish engulfing on M30–H1
🔸 Bullish Breakout (less likely):
→ Break and hold above 3420 = potential squeeze into 3445–3465
→ Must be supported by CPI upside miss or dovish FOMC tone
→ But 3445–3465 remains weak liquidity — not a safe continuation zone
I appreciate every 🚀, comment, and follow I see on my plans.
If this breakdown helped sharpen your outlook, let me know below.
I post real levels with precision — no hype, just clean structure.
Keep following for daily sniper plans built from logic, not noise. 💼⚔️
--GoldFxMinds--
Chart and structure based on Trade Nation broker feed on TradingView. For educational purposes only — not financial advice.

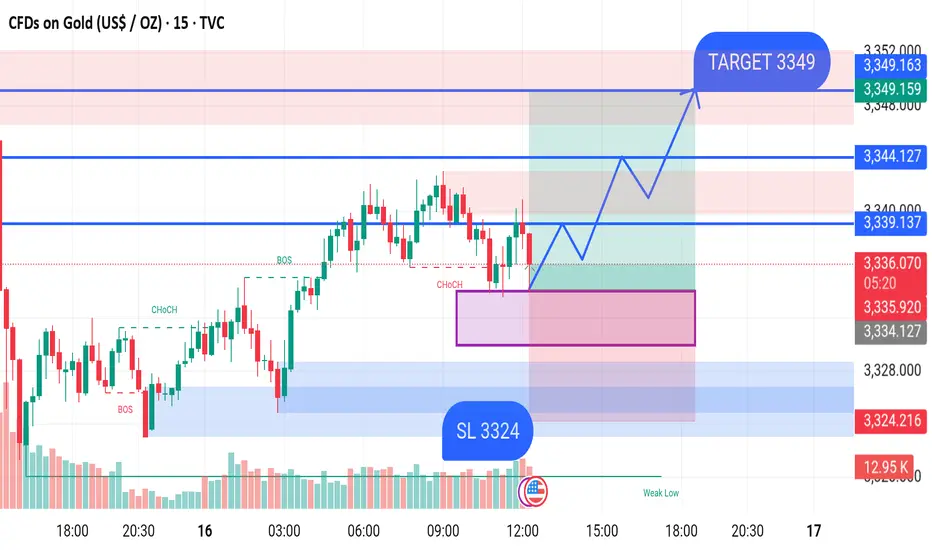
GOLD BUY M15 XAU/USD (Gold) 15-Min Chart Analysis – July 16, 2025
Price is currently consolidating around the 3,335.70 level after showing a Change of Character (CHoCH), indicating a potential shift from bearish to bullish momentum.
Key Observations:
Demand Zone: Marked in purple between 3,334 – 3,330, where buyers may step in.
Stop Loss (SL): Placed at 3,324, just below the demand zone for risk management.
Break of Structure (BOS): Confirmed to the upside, suggesting bullish intent.
Expected Move: A bounce from the demand zone, followed by higher lows and a breakout above the resistance levels.
Important Levels:
Entry Area: Near current price at 3,335
Resistance Levels:
3,339
3,344
Target: 3,349
Stop Loss: 3,324
Bias: Bullish, as long as price holds above the 3,324 support.

Excellent Profits / quick updateAs discussed throughout my yesterday's session commentary: "My position: My strategy remains the same, Buying every dip on Gold on my calculated key entry points which Gold respects and ultimately, anticipating #3,377.80 Resistance break-out to the upside."
I have broken my personal record throughout yesterday's session (#200.000 EUR Profit) using #25 and #50 Lots, Buying Gold with set of Scalp orders within #3,340's, #3,330's and final #3,327.80 reversal zone. I will not make any more moves today, will call it for the session and await tomorrow's E.U. session Highly satisfied with Profit. Needless to mention, #3,377.80 and #3,400.80 mark remains my Medium-term Target zones as I continue Buying every local Low's for us.

XAU / USD 30 Minute ChartHello traders. Here is a quick 30 minute chart showing where I am looking for potential buy scalp and sell scap trade set ups. Let's see how the current 30 minute candle closes. Pre NY volume starts coming in about 40 minutes from this writing. Big G gets a shout out. Be well and trade the trend.

Gold (XAU/USD) Analysis – July 15, 2025As outlined in our previous analyses, we anticipated a potential reversal before gold could reach the $3400 zone.
We also noted that any upward movement followed by a solid rejection could offer a valid short (sell) opportunity.
📉 Yesterday’s market reaction to the CPI release, with a drop of nearly 500 pips, has now confirmed this bearish setup.
📌 Based on current price structure, the $3350–$3360 area appears ideal for seeking short entries.
🎯 All target levels previously mentioned remain valid and in play.

GOLD TECHNICAL ANALYSIS H4 TIMEFRAMECurrent Price: ~$3,371
Trend: Currently breaking out of a downtrend channel, with a strong upward push.
Chart Pattern: Price has formed a rounded bottom and is moving higher, indicating bullish momentum
🔼 Resistance Levels (Targets):
1. First Resistance / Target: ~3,404.54 – 3,403.61
→ This is the first breakout target after crossing the trendline.
2. Final Resistance / Target: ~3,462.40 – 3,490.39
→ This zone represents the major resistance where bulls might face selling pressure.
🔽 Support Level:
Support Zone: ~3,310 – 3,320
→ This is the previous bottom and the bullish reversal zone, acting as strong support.
📈 Projected Bullish Move (According to Chart Arrows):
A pullback may occur after breaking above the trendline.
Then, price is expected to rally toward 3,403, retest, and eventually target 3,462 – 3,490 area.
✅ Key Indicators Noted:
The Ichimoku cloud shows bullish bias.
Chart shows higher lows, indicating strengthening buyer interest.
Bullish candle formations near the breakout zone support upward continuation.
🧭 Conclusion (Trade Idea):
Bias: Bullish
Entry: On breakout and retest above the trendline (around 3,360–3,370)
Targets:
1st Target: 3,404
2nd Target: 3,462
Final Target: 3,490
Stop Loss: Below 3,320 support zone
