NVIDIA - Sell off continues.So same plan as mentioned, Nvidia has to do its retracement before being able to gain more for a new ath.
NVDA trade ideas

I think this looks logica. Am I crazy?NASDAQ:NVDA has always recovered strong after the earnings dip. I think the sell off has come to the end and the pump to $160 is ready

Nvidia stumbles to test 200 MA post earningsWill the dip buyers emerge here?
US markets continue to remain on the back foot, with the tech sector in sharp focus after Nvidia’s earnings. The chip giant initially climbed over 1% in pre-market trading but swiftly reversed, dropping 4% as investors reacted to results that, while decent, failed to dazzle. With chipmakers driving market volatility and concerns mounting over US-China tech tensions, Nvidia’s performance today could set the tone for the sector.
Adding to uncertainty, Donald Trump reignited trade war fears, announcing that tariffs on Mexico, Canada, and China will take effect on 4 March.
Let's see if Nvidia dip-buyers will emerge to defend the 200-day MA around $126 area, or whether we will see further weakness heading into the close. Next key levels to watch include $120.00 and $115.00. Wednesday's low of $128.50 is now the key resistance level to watch. It would be a bullish scenario if we go back above this level now.
On a macro front, attention turns to Friday’s Core PCE data following weak economic reports, including a 4.6% slump in pending home sales and rising jobless claims. Next week we have ISM PMIs and NFP jobs report, as well as a rate decision from the ECB, all to look forward to.
By Fawad Razaqzada, market analyst with FOREX.com

NVDA : Good shopping pointshello friends
We have analyzed these stocks for you in a very simple way. In the long term...
We have identified good shopping points where you can shop.
Note that the price is at the ceiling of the channel and it is not logical to buy at the ceiling of the channel, so either we buy in case of correction or if the channel is broken and its failure is valid, we can buy.
*Trade safely with us*

AI is not a bubbleNVIDIA reported earnings of 89 cents per share on revenue of $39.33 B for Q4. While revenue grew 77.94% on a year-over-year basis. The consensus earnings estimate was 84 cents per share on revenue of $37.72 B. The company said it expects Q1 revenue of $42.14 B to $43.86 B, and gross margins of 70.5% to 71.5%, which calculates to non-GAAP earnings of 89 cents to 97 per share.
Long trade idea:
long = 130
stop = 125
profit = 160
NVDA options data:
3/21 expiry
Put Volume Total 159,655
Call Volume Total 331,044
Put/Call Volume Ratio 0.48
Put Open Interest Total 1,957,392
Call Open Interest Total 2,368,522
Put/Call Open Interest Ratio 0.83
4/17 expiry
Put Volume Total 125,626
Call Volume Total 81,625
Put/Call Volume Ratio 1.54
Put Open Interest Total 521,463
Call Open Interest Total 712,523
Put/Call Open Interest Ratio 0.73
5/16 expiry
Put Volume Total 32,339
Call Volume Total 49,339
Put/Call Volume Ratio 0.66
Put Open Interest Total 366,100
Call Open Interest Total 389,827
Put/Call Open Interest Ratio 0.94

Nvidia Flexes Bold Guidance but Can the Chipmaker Deliver on It?Chief Jensen Huang showed hubris on the earnings call right after Nvidia NVDA reported another blockbuster quarter with record sales and soaring profits. He said that demand for the new Blackwell chip is “amazing.”
“Well, I'm more enthusiastic today than I was at CES We have some 350 plants manufacturing the 1.5 million components that go into each one of the Blackwell racks, Grace Blackwell racks. Yes, it's extremely complicated,” Huang said. “Nothing is easy about what we’re doing, but we’re doing great.”
Everyone and their dog was glued to the screen after-hours Wednesday, waiting to hear what the most important person for the stock market was going to say. And many were hoping it’ll be good and Nvidia will save us from the recent selloff that spilled from tech stocks to all stocks .
And indeed, it was another stellar performance by Nvidia. For the fourth quarter ended January 26, the chipmaking giant pulled in record revenue of $39.3 billion, up 80% from a year ago, topping analyst estimates for $38 billion. Earnings per share reached $0.89 against Wall Street guidance for $0.84 a pop. Net income landed at $22.1 billion, up 80% from a year earlier.
Without a doubt, Nvidia continued its string of record-shattering results. And, what’s more, that’s also what Nvidia thinks will happen with the current quarter. The company projected revenue of $43 billion for the first three months of 2025, up 65% from the year-ago quarter when sales hit $26 billion .
To get to that figure, and keep the growth going, Nvidia will need to retain all its deep-pocketed clients like Amazon AMZN , Meta META , Microsoft MSFT and Alphabet GOOGL . These four alone make up about half of Nvidia’s revenue. Other customers with buckets of cash include ChatGPT parent OpenAI and Elon Musk’s Tesla TSLA .
As to the share price, investors didn’t really cheer the upbeat guidance or the double beat on both earnings and revenue. The stock showed virtually no reaction in extended trading — could it be that markets expected an even bigger blowout performance?
Or maybe they don’t believe in Nvidia’s business model after DeepSeek achieved for mere millions what OpenAI achieved for hundreds of millions? Year to date, Nvidia, the second-largest company in the world , is down 5% to $3.2 trillion. It’s drifted about 10% away from the all-time high hit in early January.
And with this, make sure to closely watch the earnings calendar for other hot reports as AI history is being made before our eyes.
What’s your take on Nvidia’s future? Do you think its Big Tech clients will soon whip up their own AI chips? Or is Nvidia’s AI dominance set in stone? Share your thoughts in the comment section!

NVIDIA's Momentum Analysis: Strong Fundamentals & TechnicalsUnpacking NVIDIA's powerful Q4 2025 performance with record revenue of $39.3B (up 78% YoY) and explosive Data Center growth of 93%. Technical analysis reveals strong support at the 50-day MA ($130-$134) with resistance at the all-time high ($153.13). Recent price action shows bullish momentum with key technical indicators pointing to continued strength. Essential viewing for investors navigating NVIDIA's post-earnings trajectory.

NVDA: Buying opportunityAs you can see on NVDA we have a great buying opportunity according to the chart setup.

Breaking: Nvidia ($NVDA) Surges 4% on Earnings BeatNvidia (NASDAQ: NASDAQ:NVDA ), the U.S.-based semiconductor giant, has once again outperformed market expectations, reporting $39.3 billion in Q4 revenue, a 2.7% increase beyond analyst projections. While its dominance in AI chips remains unchallenged, a surprising growth driver has emerged: its automotive and robotics segment. With demand for driver-assist technology soaring, this segment is poised to become Nvidia’s next multi-billion-dollar business.
The Rise of Nvidia’s Automotive Business
Nvidia’s automotive and robotics revenue surged by 103% year-on-year, reaching a record $570 million in Q4 FY2025. This brings its total segment revenue for the fiscal year to $1.69 billion, marking the second consecutive year above the $1 billion threshold.
Although automotive contributes just 1.45% to Nvidia’s total revenue, analysts predict exponential expansion as real-world applications of autonomous driving and robotics continue to develop.
Technical Analysis
As of the latest session, NASDAQ:NVDA closed up 3.67% and continued its positive momentum, rising 2% in premarket trading. From a technical standpoint, Nvidia is approaching a bullish breakout, supported by the following indicators:
- RSI at 48: This suggests the stock is neither overbought nor oversold, leaving ample room for an upward push.
- Key Fibonacci Levels: In case of a pullback, the 65% Fibonacci retracement level serves as a strong support zone, providing a potential rebound point.
- Breakout Potential: A move above the 1-month high could signal further bullish momentum, paving the way for new highs.
With AI-driven demand surging, and Nvidia's automotive and robotics division gaining traction, the company is well-positioned for long-term profitability. Investors should keep a close watch on technical breakouts and fundamental milestones, as Nvidia continues to redefine the future of AI and autonomous technology.

$NVDA Sideways Since Sept '24NASDAQ:NVDA stock has been trading sideways nearly six months, through multiple earnings. Also, seeing lower highs in 2025. What catalysts remain?

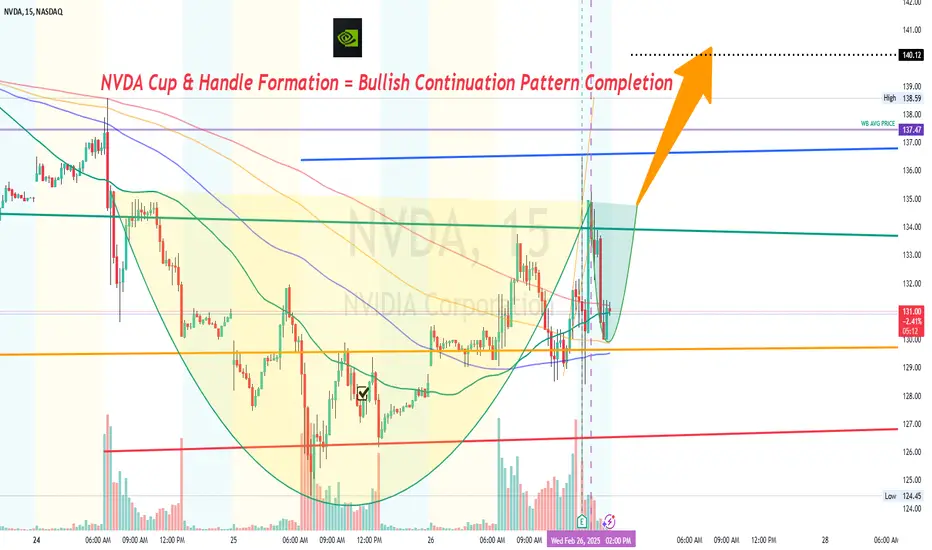
NVDA Cup & Handle FormationNVDA Cup & Handle Formation = Bullish Continuation Pattern Completion
Target Projected for Thursday Feb 27 Closing Candle/Price = $140.12
Updates:
Nvidia (NVDA) Share Price Dips Slightly After Earnings ReportNvidia (NVDA) Share Price Dips Slightly After Earnings Report
Following the close of the main trading session yesterday, Nvidia released its quarterly earnings report, exceeding analysts' expectations:
→ Earnings per share: Actual = $0.89, Expected = $0.84
→ Revenue: Actual = $39.3 billion, Expected = $38.1 billion (a 78% increase year-on-year)
It was also revealed that Nvidia’s latest AI chip family, Blackwell, generated $11 billion in sales for the quarter. This eased concerns that transitioning to the Blackwell chip series could lead to a decline in revenue.
How Nvidia (NVDA) Shares Reacted to the Earnings Report
Despite the strong earnings, Nvidia’s share price did not benefit significantly. Post-market trading saw heightened volatility, with NVDA shares fluctuating between $126 and $136 in the first few minutes after the report’s release.
As volatility subsided, NVDA stabilised around $129, slightly below Wednesday’s closing price of $131.37, reflecting a decline of approximately 1.7%.
Technical Analysis of NVDA Stock Chart
In February, NVDA’s share price continued to hold below the lower boundary of its previous upward trend channel after failing to break the psychological barrier at $150. Specifically:
→ The lower channel boundary has now acted as resistance (indicated by the arrow).
→ A downward trend channel (marked in red) is becoming increasingly apparent.
As a result, NVDA shares have not shown the ability to recover from the panic sell-off on 27 January, when Nvidia and other leading AI companies saw their stocks plummet following the success of Chinese startup DeepSeek.
NVDA Share Price Forecast
Analysts remain optimistic, possibly due to the expected increase in AI-related capital expenditure by major tech firms in 2025. Additionally, the upcoming GTC conference could serve as a bullish catalyst, likely featuring new product announcements within the Blackwell family.
According to TipRanks:
→ 33 out of 36 analysts recommend buying NVDA shares.
→ The 12-month average price target for NVDA is $177.
Trade on TradingView with FXOpen. Consider opening an account and access over 700 markets with tight spreads from 0.0 pips and low commissions from $1.50 per lot.
This article represents the opinion of the Companies operating under the FXOpen brand only. It is not to be construed as an offer, solicitation, or recommendation with respect to products and services provided by the Companies operating under the FXOpen brand, nor is it to be considered financial advice.

NVIDIA to $228If Nvidia were truly done for, why is it impossible to find their latest 5000 series GPUs?
Even if someone wanted to buy one, they simply can't.
The reason lies in Nvidia's commitment to fulfilling the soaring demand from AI data centers, which has left them unable to produce enough H100 and H200 models.
This situation also allows Nvidia to increase their profit margins significantly, capitalizing on the disparity between demand and the media frenzy surrounding them.
DeepSeek serves as a prime example of how out of touch mainstream media can be.
All DeepSeek did was replicate Chat GPT.
Training models requires substantial computing power. The panic surrounding Nvidia and other semiconductor companies is quite amusing; the demand for computing power is skyrocketing!
The gap between the reality of the AI mega-trend and the narrow focus of mainstream media is staggering! It's astonishingly out of touch! Just as out of touch as Cramer was when he declared META was done at $100, or when he thought Chat GPT would obliterate Google at $88.
Stock prices fluctuate between being overvalued and undervalued. While we have metrics like EGF and PE ratios to assess valuation, indicating that Nvidia is currently inexpensive, this doesn't guarantee it won't drop further. However, it is generally wiser to buy stocks when they are cheap rather than when they are costly.
The greater the deviation from the high then the greater the BUYING OPPORTUNITY being presented for the very best leading companies.
The key takeaway is that the deeper Nvidia falls during its corrections, the more advantageous it could be.
Those who are experiencing anxiety during these declines may find themselves selling at a loss, or for a marginal profit possibly around previous highs, while the stock has the potential to rise to $228 and beyond.
The potential for growth is significant; the $228 Fibonacci extension may not represent the peak. Attempting to predict a top for Nvidia could be misguided. Once it reaches $228, Nvidia might maintain a valuation similar to its current $130 level.

NVDA XABCD Best Level to BUY/HOLD 30% gains🔸Hello traders, today let's review recent price chart for NVDA.
Well defined swings in progress, expecting further downside before
the tide finally turns for NVDA bulls. Currently it's recommended to stay out.
🔸Speculative XABCD defined by points: X 150, A 115, B 140, C 120, D 160.
most points validated already, C/D pending.
🔸Well defined swings in progress, so expecting a low near 120 before
reversal and new swing higher.
🔸Recommended strategy bulls: Bulls wait for correction to complete at/near 129 usd in March 2025 and get ready to BUY/HOLD low, this is a swing trade setup, so will take longer to hit target, patience required. final TP is 160 USD, 30% upside from point C/buy entry. good luck traders!
🎁Please hit the like button and
🎁Leave a comment to support our team!
RISK DISCLAIMER:
Trading Futures , Forex, CFDs and Stocks involves a risk of loss.
Please consider carefully if such trading is appropriate for you.
Past performance is not indicative of future results.
Always limit your leverage and use tight stop loss.

Chart Pattern Analysis of NVDA
K4 break up the previous high price and close upon the resistance.
It is a bull signal for the market.
But there is still a concern about the lower demands along the recent candles.
Perhaps K4 is a fake up candle.
If that is a fact,
K5 will not likely create a higher high and usually will break down the resistant immediately.
Considered K5 is near the support along the uptrend channel,
The market will choose to break up or fall down here.
If K5 break up K4,
It will be a good place to buy then.
If K5 close below the resistance,
The consolidation will expand down to test 116USD.
It will be another good place to buy then.

Nvidia after earningschances are high for a retracement, since the stock shows not much of buying pressure.
My analysis is based on experience not facts.

NVDA expected to remain volatile near term before bullish move!!Expecting to see sellers resume control at 135-136 levels near term, to take price back to 118-120$ gap fill target for liquidity purposes.
After that, looking for price advancement to 158-165 buy-side target levels for final high on weekly buy cycle.

NVDA at a Critical Level! Will This Bounce Hold or Break? Technical Analysis for February 27, 2025:
1. Current Price Action:
* NVDA saw a significant drop but found temporary support near $124.39, aligning with a key volume area.
* A falling wedge pattern has formed, with a slight breakout attempt before a rejection at $130-$132.
* Strong volume increase at the lows suggests buyers are stepping in.
2. Key Levels to Watch:
* Support: $124.39 (Previous low) → Critical level; if broken, next major demand zones are $120 & $115.
* Resistance: $130 - $132 (Point of Control - POC) → Needs a break for bullish continuation.
* Upside Targets: $138.50, $141.50, $143.44 (Major resistance walls).
3. Indicators Analysis:
* MACD: Bearish momentum but could reverse if volume increases.
* Stoch RSI: Oversold; potential for a short-term bounce.
* Volume Profile: Heavy resistance at $130-$132; low liquidity below $124 could accelerate downside.
GEX & Option Strategy for Tomorrow and the Week:
1. Gamma Exposure (GEX) Insights:
* Call Walls: $138.50, $143.44, $150 → Resistance areas; breaking these could trigger a gamma squeeze.
* Put Walls: $120, $118, $115 → Key support zones where market makers may buy back short positions.
2. IV & Sentiment:
* IVR: 59.4 (moderate)
* IVx Avg: 87.1 (elevated) → High implied volatility favors option sellers.
* Call Positioning: 16.9% bullish sentiment.
* GEX Sentiment: Slightly bearish for now but could flip bullish above $132.
3. Trading Suggestions:
* Bullish Setup: Long if NVDA reclaims $132; target $138-$143, stop $129.
* Bearish Setup: Short if NVDA fails to hold $130; target $124-$120, stop $133.
* Options Play: Selling put spreads at $120 support or call spreads near $143 resistance.
📌 My Thoughts & Suggestion:
* NVDA is in a make-or-break zone at $130-$132; a strong break here could lead to a recovery toward $138-$143.
* If market weakness continues, $124-$120 support could get tested.
* Be cautious with options as IV is high, making premiums expensive.
⚠️ Disclaimer:
This analysis is for educational purposes only and does not constitute financial advice. Always do your own research and manage your risk before trading. 🚀

NVDA ... Nvidia levels for you to EnjoyHere is the 4hr chart with the Rainbow-Railroad employed...Make sure as always to use the Log "L" function in the bottom right to see hidden levels..
!0 min close up of earnings with Log:
10 min close up of earnings without Log:
10 min panned view of recent price action with Log:
10 min panned view of recent price action without Log
And the Daily Rainbow-Railroad....a modification to the CyQo-Cpyder's Nest:

NVIDIA Stock Chart Fibonacci Analysis 022625
Trading Idea
1) Find a FIBO slingshot
2) Check FIBO 61.80% level
3) Entry Point > 125/61.80%
Chart time frame: C
A) 15 min(1W-3M)
B) 1 hr(3M-6M)
C) 4 hr(6M-1year)
D) 1 day(1-3years)
Stock progress: A
A) Keep rising over 61.80% resistance
B) 61.80% resistance
C) 61.80% support
D) Hit the bottom
E) Hit the top
Stocks rise as they rise from support and fall from resistance. Our goal is to find a low support point and enter. It can be referred to as buying at the pullback point. The pullback point can be found with a Fibonacci extension of 61.80%. This is a step to find entry level. 1) Find a triangle (Fibonacci Speed Fan Line) that connects the high (resistance) and low (support) points of the stock in progress, where it is continuously expressed as a Slingshot, 2) and create a Fibonacci extension level for the first rising wave from the start point of slingshot pattern.
When the current price goes over 61.80% level , that can be a good entry point, especially if the SMA 100 and 200 curves are gathered together at 61.80%, it is a very good entry point.
As a great help, tradingview provides these Fibonacci speed fan lines and extension levels with ease. So if you use the Fibonacci fan line, the extension level, and the SMA 100/200 curve well, you can find an entry point for the stock market. At least you have to enter at this low point to avoid trading failure, and if you are skilled at entering this low point, with fibonacci6180 technique, your reading skill to chart will be greatly improved.
If you want to do day trading, please set the time frame to 5 minutes or 15 minutes, and you will see many of the low point of rising stocks.
If want to prefer long term range trading, you can set the time frame to 1 hr or 1 day.

NVIDIA (NVDA) Scalping Strategy🔥 Market Overview:
Trend: Short-term recovery after a sharp drop; overall structure still fragile.
Key Levels:
Resistance: $133.10, $135.00
Support: $130.00, $126.90
Indicators:
EMA9 below EMA200 → bearish pressure, but attempting a breakout.
MACD shows weak momentum, nearing a crossover.
RSI 54.56 (neutral), showing no strong divergence.
Risk of Short Squeeze? Low, but if price stabilizes above $133.10, it could trigger a rally.
Market Maker Activity: Accumulation signs, possible liquidity grab before a move.
🔥 Scalping Strategy:
🩸 1. Momentum Scalping (If Breakout Above $133.10)
Buy near: $133.10
Target: $135.00
Stop-loss: $132.00
Risk-to-Reward: 1:2
🩸 2. Range Scalping (If Price Stays Between $130 - $133)
Buy near: $130.00
Sell near: $133.00
Stop-loss: $129.50
Profit Potential: ~2.3%
🩸 3. Breakout Scalping (If Below $130.00)
Short below: $129.50
Target: $126.90
Stop-loss: $130.30
Risk-to-Reward: 1:3
🔥 Mid-Term Trend Forecast (1-3 Weeks):
If $133.10 holds, bullish recovery → potential run to $138-$140.
If $130.00 fails, bearish extension → drop to $126.90.
🔥 News & Market Context:
Earnings Report Coming Up: Potential high volatility.
AI Sector Sentiment: NVIDIA is a leader, but recent earnings of tech firms will impact movement.
Institutional Orders: Watching for heavy inflows.
🔥 Decision:
🩸 Short-term Play: Range scalping between $130 - $133 is the safest bet.
🩸 Mid-term Play: Only long above $133.10 or short below $130.00.
🩸 Ideal Play: Momentum scalping with tight stops.
👑 Final Verdict: Patience before earnings—trade smart, avoid traps.
🔥 LucanInvestor's Quote:
"Precision in execution is what separates traders from gamblers."

NVDA earnings bullish I do dowsing with a pendulum & it's a good test to try it for earnings since there are big moves. It's kind of hit or miss, but really interesting & everyone follows NVDA still, so let's see what energy it has!
I get nervous when there's bullish energy & the stock moves as I'm doing my reading, but this is pretty bullish info I have. Watch for a move up maybe 12%, which takes it to around $145. I also got the number 47, so that's a possibility also.
I did have a little bearishness in saying to sell rallies. I'd be watching the date 3/3 for a possible retracement back down if it does, in fact, go up. It pretty bullish short term though.
I have positive energy in indexes too, so I thought it may be in part because NVDA could influence things, so we'll see.

Magnificent Seven & Hot Stocks: A Technical OverviewHello,
The past few days and weeks have brought a lot of movement in the stock market, and things seem a bit more redish than before. However, these kinds of moments also bring good opportunities—if you know where to look.
That’s why I decided to take a closer look at the some stocks from Magnificent Seven, scan some of the top market cap stocks, and give a short overview of what’s happening and what to watch.
Since technical analysis helps bring clarity in uncertain times, I will go over some key levels and liquidity zones that could present good opportunities. I will also cover a few stocks that are currently making headlines and generating a lot of interest in the investment world—such as Robinhood (HOOD) and Palantir (PLTR).
Let’s see what the market has to offer.
Microsoft (MSFT)
Microsoft has not made any major moves in the past few weeks, but selling pressure has started to build up, and the stock is now trading at its lowest levels in the past six months.
The most interesting and strongest support area is between $290 and $300. This is a level worth keeping an eye on.
--------------
Amazon (AMZN)
Yesterday, I got an alert from TradingView that AMZN has dropped into an interesting price zone after a small correction. If you don’t already use alerts, I highly recommend setting them up—keeping track of every stock manually is nearly impossible.
The $175–$210 zone is technically solid. Yes, it’s a wide range but there are different strategies you can use here.
Amazon (AMZN) – What to do?
If you don’t own AMZN yet, this could be a good spot to start building a position slowly. Buy a little in the upper part, a little in the middle, and a little in the lower part of this zone to get a balanced entry.
If you already own AMZN, I’d rather wait and aim for the middle of the range if you want to add more. If the stock takes off from here, you already have a position, so there’s no real FOMO. No need to rush.
Of course, this is just a technical view—you should still analyze the fundamentals and your investment thesis. The technicals have spoken and now it’s time to listen to the fundamentals. That way, you get the full picture and can react accordingly.
--------------
Alphabet (GOOG)
GOOG failed to break through the psychological $200 level. It has tested this level multiple times since the start of the year, but the result has been red candles.
If you already own the stock and are considering adding more, or if you are thinking about an entry, the $140–$160 zone is worth watching. At the moment, I don’t see a more logical technical entry.
--------------
Meta Platforms (META)
META has dropped 12% from its all-time high in just a few weeks. The stock has now slowly come to, what I call, a "picking zone" (if you have a better name for it, let me know! :D)—meaning a price range where those who make regular buys might want to pay attention.
Right now, the key levels to watch are ~$612 and ~$500, with $500 being the stronger level. The price has consolidated there a bit longer than around $612, and it also acts as a psychological support level.
--------------
Berkshire Hathaway (BRK.B)
Berkshire has reached what I consider a profit-taking zone. If your fingers are itching and your wallet is waiting for a top-up, then why not? This doesn’t mean selling everything, but it could be a good spot for a partial exit—especially if you need capital for something else.
Why is this a logical profit-taking point?
Looking at previous price behavior around round numbers, we can see a pattern that works every time and your money can be “stuck” for years.
When a stock approaches a big round number for the first time, it tends to:
Consolidate – move sideways for a long time.
Get a strong correction – like Berkshire has done before.
Let’s make the round number concept clearer.
Imagine a stock price starts moving up from $30 and eventually reaches $1000.
Within this range, the key round numbers for me are: $50, $100, $200, $500, and $1000. These are levels where major market reactions often occur or levels that I trust the most as a criterion.
Let’s take Berkshire for example, touching these numbers for the first time:
$50 → 50% drop, took 5 years to recover.
$100 → Another 50% drop, also took 5 years to break higher.
$200 → Multi-year consolidation, 20% drop.
$500 → And now we’re here—your choice!
In a long-term portfolio, there are essentially two types of sales:
The investment thesis is no longer valid
Capital is needed for another purpose
If neither of these conditions is met, there’s no real reason to sell. However, if you need capital within the next six months, this could be a good point to do so. Historically, we’ve seen a pattern where the stock either undergoes a correction or remains stagnant for an extended period.
That makes it a perfect candidate for profit-taking—and if a correction does happen, there’s always the opportunity to buy back at lower prices.
At the moment, buying this stock could mean it stays within this price range for a few years, so I wouldn’t rush into new purchases.
--------------
Tesla (TSLA)
Historically, Tesla has followed technical analysis well due to its high volatility. It reflects market psychology very clearly, leaving visible footprints on the chart...
-----
I also cover these topics in-depth over on my Substack channel, where I break down the full picture and share my insights on the rest. If you want the complete breakdown and my take on what’s next, head over to my Substack (ENG).
🔗 Find the link in my BIO under the Website icon or simply copy and paste it directly.
See you there! 👀
Cheers,
Vaido
