XIAOMI - 1810 - Add to the watchlist - buy on strengthXiaomi price rallies have previously failed - so no rush to enter this trade - yet. 
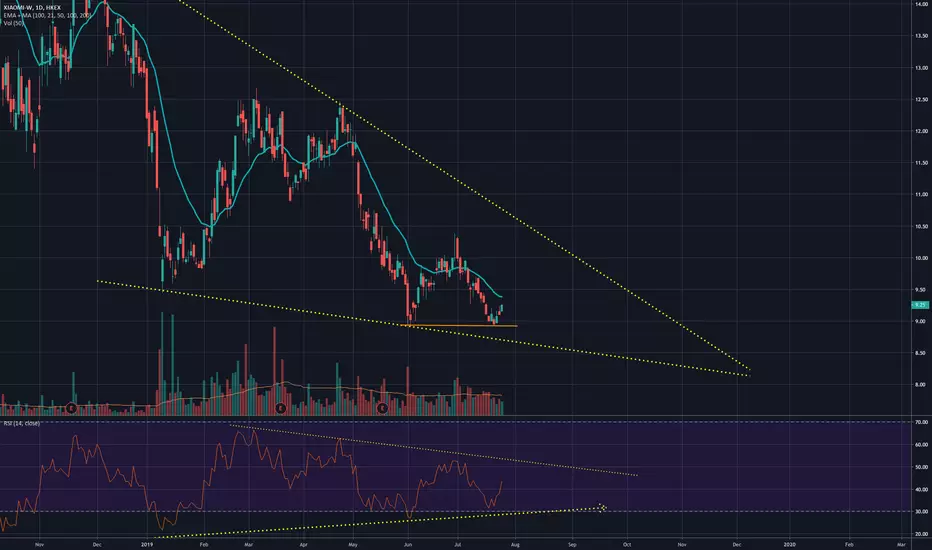
A new all time low recently printed and I have drawn a green count back line from the height of the 3rd lowest candle. An initial close above the line triggers my alert but with caution. I will wait for price to hold above the line a bit longer and monitor for supporting signals like rising buyer interest - volume and price closing at highs for the day rather than the lows.HLongby D55555Updated Jul 7, 20191
XIAOMI: Bullish Bat Pattern for XIAOMIXIAOMI has a deep drop recently, but it maybe give us a chance to buy. A bullish Bat pattern is forming. The PRC is at 9.8 where a good demand zone locates. So it is good to buy at 9.6-9.9 levels. Entry: 9.6-9.9 SL: below 9.4 TP1: 10.7 TP2: 11.9 TP3: 13.5 and further moreHLongby AdamHongUpdated Jul 6, 20194
Swing TradeRetest gap to the 1.382 Fib extension at the end of a wave count??????? Lets plan for an A-B-C pattern for a swing trade.OLongby kdubbw12Jun 4, 20192
20190519 Xiaomi will meet around 9.7Wait for a while and see what will happen with USA And CHINA trading war You can continue to buy some currently.Hby superkevinyenMay 20, 20190
fighting Xiao MIsupport price is green zone, future price will be HKD 17HLongby Jason_Liu1May 14, 20193
0408 Sell 1810HK Xiaomi companyWatch out of this, every price is matching Fib line. It will go down back to the previous low and pop up. Pop up reason is because 1810HK may be able to trade after June because of HK <-> China trading policy for Xiaomi.HShortby superkevinyenApr 7, 20192
XIACY Bearish Channel | Bearish Indicators formingMultiple Bearish indicators. Waiting for retrace and proof of channel. OShortby J3rk1eMar 8, 20191
Possible Xiaomi Inverse Head and Shoulders playXiaomi descending wedge break. Possible Inverse Head and Shoulders pattern.Hby OriginalasUpdated Mar 1, 20192