GOLD Potential ReversalIt appears that we've reached a significant top in the market, with price action showing signs of a potential dump. Liquidity has been taken out at this level, and we are now looking at lower price targets, which align with the lines below, marking new liquidity points. These areas could serve as key support levels as the market tests them for further reaction.
The price structure suggests a possible drop to the target zones around 3,300 / 3,200 & 2970 where we could see renewed buying interest. Stay cautious as we approach these levels, as they may present opportunities for short entries ahead of the market correction.
Keep an eye on the evolving price action for further confirmations.
GDR1! trade ideas

Gold Hourly & 4H Analysis UpdateGold CMP 3290
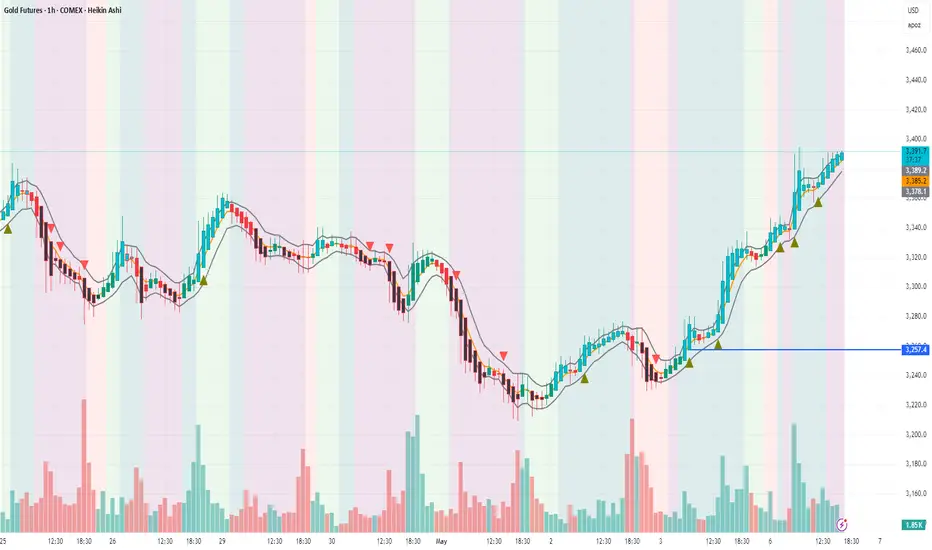
Yesterday on the Hourly chart , Gold gave a Buy Signal at 3257 , and today it rallied up to 3395 — a clear momentum of 138 points . It also gave a fresh breakout on the 4H time frame , indicating strong upward momentum.
Currently, resistance is seen at the 3420 levels .
If Gold breaches 3420 , we could see further upside toward 3450–3465+ levels .
However, failure to breach 3420 may trigger a reversal .
Positional traders can continue to Hold Gold positions with a Stop Loss at 3355 levels


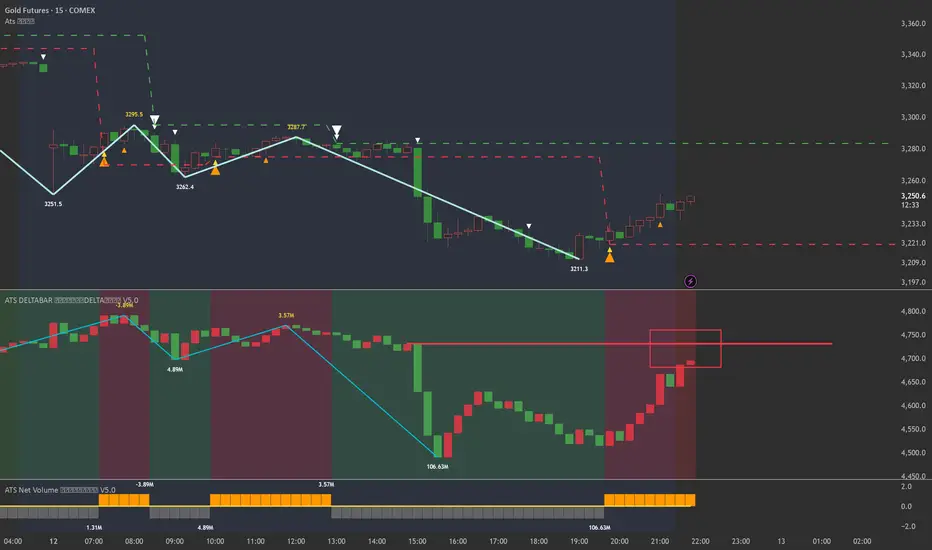
Multiple markets Monday the gold came to a 382 which means we should be looking for sellers even though there's no real evidence of selling even to this point at 12:30 p.m. on Monday. I have a bias that the smart money is going to drive the gold lower...... but I need more evidence from the sellers. I think there are similar issues with the ES


Price currently Bullish...But will it continue for the week?This is bullish price action i was expecting. Im just now waiting for a solid area for entry. Just have to wait for the killzones and things to line up inside of the killzone. cause outside of the killzones its nothing but chop and impulsive action that can throw you off.

GOLD LONG IDEA for next week - targeting growth**Direction:** **LONG**
**LONG Targets:**
- **T1 = $3280**
- **T2 = $3320**
**Stop Levels:**
- **S1 = $3220**
- **S2 = $3190**
**Wisdom of Professional Traders:**
This analysis synthesizes insights from thousands of professional traders and market experts, leveraging collective intelligence to identify high-probability trade setups. The wisdom of crowds principle suggests that aggregated market perspectives from experienced professionals often outperform individual forecasts, reducing cognitive biases and highlighting consensus opportunities in Gold.
**Key Insights:**
Gold has continued as a refuge for capital amidst macroeconomic uncertainties, maintaining a strong bullish momentum due to increasing inflationary pressures and global geopolitical tensions. Market experts suggest the Federal Reserve's dovish monetary tone may further fuel demand for Gold, coupled with a weakening US dollar that enhances attractive price levels. The recent trend shows heightened levels of institutional buying, signaling potential for upward movement. Favorable seasonality and demand during market risk cycles enhance its appeal.
Recent supply dynamics, driven by mining constraints and costly extraction levels, contribute to a limited Gold supply market scenario. With central bank reserves gradually accumulating Gold to hedge risks, we anticipate robust demand levels supporting prices. Analysts highlight that hedge funds and sovereign wealth funds show extreme interest towards additional Gold allocation—advising LONG strategies with focus...


Lows Swept! Now we should get Bullish action on Gold!Waited for price to sweep lows before looking for areas to buy. We got that sweep and its now the end of the week. We have been bearish all week. I'm not sure if it will go full on bullish cause we are in a new month and its Friday. They might just move sideways and wait for next week to push. We will take what we can get.

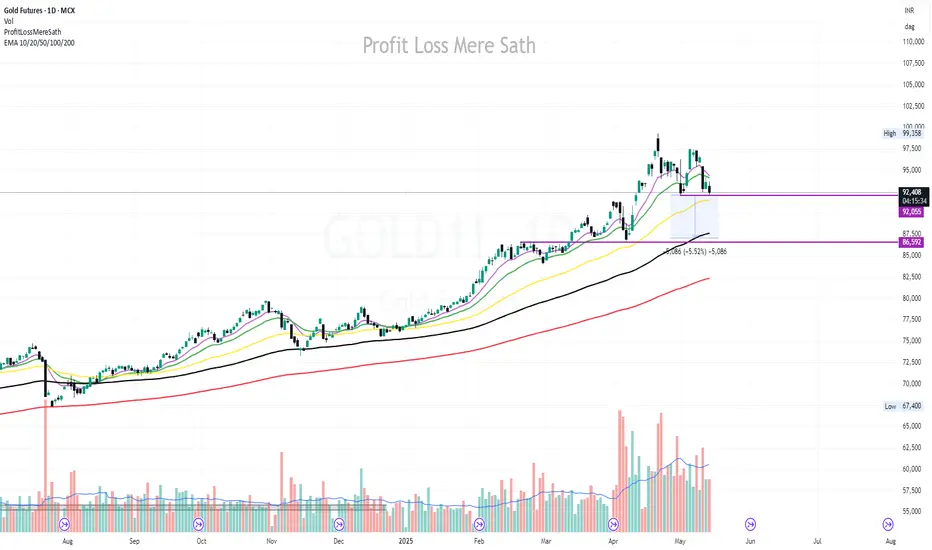
Gold Futures Analysis (MCX) – Target 87,000/- Chart Date: May 14, 2025
CMP: ₹92,558
Change: -1.16% | Volume: 14.13K
Gold has shown weakness after a strong uptrend from early February. Currently, it is consolidating near the ₹92,000 level, just above the 50 EMA (₹91,526). The price is hovering near a key support zone highlighted between ₹92,055 and ₹91,526.
📉 Key Observations:
Price rejected near recent swing high of ₹99,358.
Currently testing the 50 EMA. A breakdown below this may trigger further downside toward ₹87,500–₹86,592 demand zone.
Volume declining on recent candles – indicating weakening bullish momentum.
EMA Cluster (10/20/50) flattening out – potential trend reversal or deeper pullback in progress.
📌 Levels to Watch:
Support: ₹92,055 → ₹91,526 | Below that: ₹87,500 & ₹86,592
Resistance: ₹94,160 (20 EMA), ₹94,434 (10 EMA)
Breakdown Target Zone: ₹87,500 (5.52% from current price)
🔔 Strategy:
Wait for price action near the support zone. If breakdown confirms with volume, look for short opportunities with a tight SL above 50 EMA. Long trades only if strong reversal candles appear near ₹91.5k zone.
📊 EMA: 10/20/50/100/200 plotted for dynamic trend & support insights.

Gold- 50 day ema in playAs my bearish gold call materializes, I must be aware of the 50 day ema. For all the reasons previously stated, gold is moving lower and it makes sense based on the patterns, divergences, support broken, etc. However, the 50 day ema support level can easily wipeout bearish sentiment if it holds. The 50 day ema is far more powerful than the multiple reasons to short gold. It is such a widely followed indicator and it lets new buyers come into the market to halt the price decline and further more, there will be a cohort of traders that close (buy) their short positions at the 50 day ema. So it almost becomes a self fulfilling prophecy.


Gold’s Showdown: Bulls vs. Bears at the Make or Break Level🚀 Gold on the Edge: Breakout or Fakeout?
Alright, gather around, folks. Gold’s approaching that ⚔️ Make or Break Level, and this is where things get spicy. It’s like watching two fighters square up—you know something big is about to happen.
💡 Why This Level Matters
We’re at the spot where bulls and bears are throwing shade and maybe a few punches. This level isn’t just another line on the chart; it’s the VIP zone where momentum either takes off or taps out.
Right now, we’re leaning bullish—especially if Gold punches through and holds above this zone. We’re looking for a breakout that could take us toward 3,380, maybe even 3,420 if the party keeps going.
But… if the bears win this round and push back, we’re eyeing 3,288 as a second chance for buyers. Think of it as a rebound opportunity—if Gold stabilizes there, it could still be game on for the bulls.
📝 Our Playbook:
Breakout confirmed? Ride the momentum.
Fakeout rejection? Watch for buys at 3,288—a possible second chance for the bulls.
Stay sharp and react—no hero moves. We’re letting the price action decide.
Your thoughts? Bullish or bearish on Gold at this level? 🐂🐻

Gold Approaches Critical Resistance Level: Bullish Outlook Ahead
Current Price: $3277.40
Direction: LONG
Targets:
- T1 = $3362.00
- T2 = $3429.00
Stop Levels:
- S1 = $3234.00
- S2 = $3178.00
**Wisdom of Professional Traders:**
This analysis synthesizes insights from thousands of professional traders and market experts, leveraging collective intelligence to identify high-probability trade setups. The wisdom of crowds principle suggests that aggregated market perspectives from experienced professionals often outperform individual forecasts, reducing cognitive biases and highlighting consensus opportunities in Gold.
**Key Insights:**
Gold is entering an important consolidation phase, with mixed sentiment emerging from macroeconomic conditions. Geopolitical uncertainties and inflationary pressures are driving its safe-haven appeal, while the potential for rate adjustments by major economies adds to its bullish prospects. If gold breaches its key resistance levels, it could attract significant speculative buying, pushing prices higher. Meanwhile, minor pullbacks should not be ruled out, but overall resilience suggests an upward bias.
**Recent Performance:**
Gold has demonstrated strength in recent weeks, currently trading near $3277.40 after holding firm amidst fluctuating equity and bond markets. Safe-haven demand has largely supported its price action, with previous rallies garnering momentum from risk-off market stances. However, consolidation in a tight range suggests traders are evaluating risk factors before taking significant positions.
**Expert Analysis:**
Market analysts point out that geopolitical tensions, such as the ongoing U.S.-China trade disputes, alongside Federal Reserve policy discussions, are likely to impact gold's trajectory. Expectations for softer monetary policies globally also favor gold, as does increased interest in gold-backed financial assets. On the flip side, U.S. Dollar strength remains a temporary headwind, suppressing gold's immediate upside.
**News Impact:**
Recent headlines around potential gold-backed Treasury securities and inflation risks have reinvigorated gold's potential as a hedge against uncertainty. Escalations in geopolitical events or further dovish commentary from central banks could amplify this momentum. Traders should closely monitor these developments, as gold's sensitivity to macroeconomic news often dictates sharp moves.
**Trading Recommendation:**
Based on current market dynamics, traders should consider a bullish position in gold. The safe-haven narrative and technical resilience present a high-probability setup, with clearly defined targets and stops to manage risk. As gold approaches critical resistance levels, this setup favors upside potential over the next few trading sessions.

Gold Is Doing What Ever Gold Wants To DoPreviously I posted a reading where I said gold was to go a bit down before is went up. But Gold didn't go down, and went straight up.
But it did go up right :D
Right now I strongly believe gold is in a wxy correction.
And I think will finish the y-wave i the green box area somewhere between 3,147 and 3,077, which is the 100-123% fib-level of the w-wave.
The reason I believe this, is at that timewise the y-wave will here have taken as long as the w-wave, and I the price is heading for that cyan median line. And normally price will also go to the bottom and a bit below of the Kennedy line.
Multiple factors are pointing to that level.
When price hits that level, I believe we will see a 5th level to the upside where 4,000 definitely is in play.
I will include a link to a higher degree reading, where you can see I believe gold has finished a third wave, so we still need a 5th wave to the upside.

