NATGAS BULLISH BREAKOUT|LONG|
✅NATGAS is trading in an
Uptrend and we are seeing
A bullish breakout which
Makes us bullish biased and
We will be expecting a
Further move up
LONG🚀
✅Like and subscribe to never miss a new idea!✅
GWMJ2027 trade ideas

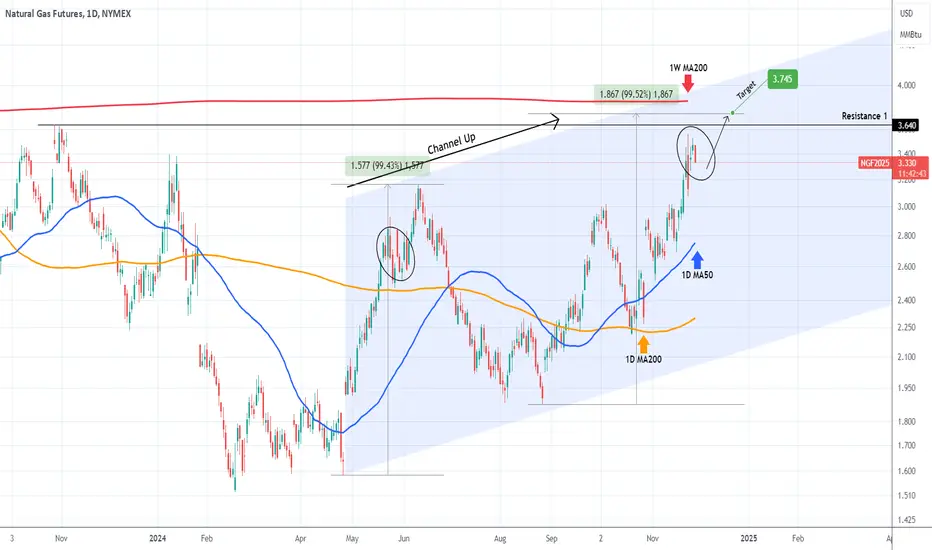
NATURAL GAS Final push before peakingNatural Gas (NG1!) rose and hit our 2.900 Target called on our last analysis (August 29, see chart below) and after a pull-back, broke above the Triangle:
The Triangle transitioned to a Channel Up and the price is already near the end of its Bullish Leg. The 1W MA200 (red trend-line) is the long-term Resistance (untouched since January 17 2023) so only above it can we justify a new bullish trend.
Until then, our Target is 3.745, which represents a +99.50% rise from the last Higher Low, which is the same % rise as the first Bullish Leg of the Channel Up.
-------------------------------------------------------------------------------
** Please LIKE 👍, FOLLOW ✅, SHARE 🙌 and COMMENT ✍ if you enjoy this idea! Also share your ideas and charts in the comments section below! This is best way to keep it relevant, support us, keep the content here free and allow the idea to reach as many people as possible. **
-------------------------------------------------------------------------------
💸💸💸💸💸💸
👇 👇 👇 👇 👇 👇
NATGAS Set To Fall! SELL!
My dear friends,
My technical analysis for NATGAS is below:
The market is trading on 3.122 pivot level.
Bias - Bearish
Technical Indicators: Both Super Trend & Pivot HL indicate a highly probable Bearish continuation.
Target - 2.910
Recommended Stop Loss - 3.241
About Used Indicators:
A pivot point is a technical analysis indicator, or calculations, used to determine the overall trend of the market over different time frames.
———————————
WISH YOU ALL LUCK

Natural Gas: Analyzing Seasonal Trends and Supply PressuresIn the natural gas market, we observe a critical juncture that suggests a potential shift in pricing trends. Over the past decade, historical data has revealed a recurring seasonal pattern that may indicate the onset of a bearish phase during this particular time of year.
Currently, the market is approaching a significant supply zone, which could serve as a pivotal trigger for price corrections. This area has consistently tested traders' sentiments, and if the pressures of supply outstrip demand, it may catalyze a downward movement in prices.
Given these observations, positioning for a short scenario seems increasingly viable. As market participants weigh their options, it is essential to remain vigilant and analyze how these supply-demand dynamics will unfold in the coming weeks. Understanding the interplay between seasonal trends and market sentiment will be crucial as we navigate this potentially shifting landscape in the natural gas sector.
✅ Please share your thoughts about NG in the comments section below and HIT LIKE if you appreciate my analysis. Don't forget to FOLLOW ME; you will help us a lot with this small contribution.

NatGAS is heating upA close above the white Center-Line projects higher prices to come.
There are 2 scenarios I see:
1. pull-back to the white CL, then up.
2. cross above the petrol CL, further and fast continuation to the north.
...oh, there's 3rd scenario:
3. price is getting punched back below the white Center-Line again. If that comes true, price has another chance to go south, with a target at the 1/4 line, or even way down to the L-MLH.

NATGAS REBOUND AHEAD|LONG|
✅NATGAS is approaching a demand level around 3.00$
So according to our strategy
We will be looking for the signs of the reversal in the trend
To jump onto the bearish bandwagon just on time to get the best
Risk reward ratio for us
LONG🚀
✅Like and subscribe to never miss a new idea!✅

Natural gas, Target 200%Natural gas with a target of 200%, the analysis of which I shared earlier, has increased to date and is close to the expected profit. This investment has had a positive return from the moment the analysis was sent to date and will reach a profit of 200% as expected.
Sasha Charkhchian

NATGAS SHORT FROM RESISTANCE|
✅NATGAS is going up now
But a strong resistance level is ahead of 3.646$
Thus I am expecting a pullback
And a move down towards the target at 3.300$
SHORT🔥
✅Like and subscribe to never miss a new idea!✅

Natural gas is in the Selling direction Hello Traders
In This Chart NATGAS HOURLY Forex Forecast By FOREX PLANET
today NATGAS analysis 👆
🟢This Chart includes_ (NATGAS market update)
🟢What is The Next Opportunity on NATGAS Market
🟢how to Enter to the Valid Entry With Assurance Profit
This CHART is For Trader's that Want to Improve Their Technical Analysis Skills and Their Trading By Understanding How To Analyze The Market Using Multiple Timeframes and Understanding The Bigger Picture on the Charts

Natural Gas BULLISH REVERSAL!!!All eyes on NYMEX:NG1! !!! Macro chart's about to confirm a bullish trend as price is making lower highs and higher highs. Ideally we want a strong close above $3.6. Any retrace towards $2.5 should be a buy opportunity. HUGE FVG to the upside.

Natural Gas - Bullish Momentum Re-rating?The last few weeks have been huge for Natural Gas NYMEX:NG1!
...But why are Natural Gas futures up over 20%?
Here are some potential reasons:
Colder than Forecasted Winter coming for the US
Trump Administration favorable of Natural Gas as future energy source
Purchase Spree by Funds with existing net short Positions
Although the Natural Gas market in its entirety is complex, these reasons do present as potential catalysts to an appreciating price environment.
But is there potential for further upside going forward?
Looking at the chart, we can see a recent breakout attempt above the $3.2 region - This has resulted in an official re-rating of momentum to 'Bullish', as signified by the blue symbol (IMO).
Our Price Guide:
Upside continuation potential if price can hold above $3.400
Significant bearish continuation risk potential if price retreats back below the $3.076 mark
We're inspired to bring you the latest developments across worldwide markets, helping you look in the right place, at the right time - We will continue to monitor the Natural Gas market in the event there are any rapid changes.
Thank you for reading! Stay tuned for further updates, and we look forward to being of service along your trading & investing journey...
Please note all information contained within this post is strictly for informational purposes only and is not intended to be investment advice. DYOR & Consult your licensed financial advisors before acting on any information contained within this post.
Love & Wisdom,

Natural Gas | Oil | Dollar | Silver | Gold Price ForecastNatural Gas stock Bulls Support & Resistance Guide

NG1! WEEK OF 11/18/24NG1! WEEK OF 11/18/24
To maintain simplicity, once the price moves beyond the WHITE range, monitor for a potential retest of the breached level.
Be prepared to initiate long or short positions targeting the YELLOW ranges.While prices may surpass the YELLOW range targets, these levels provide a robust framework for securing profits. 🎯🫡
*These levels are derived from comprehensive backtesting and research, demonstrating over 90% accuracy. This statistical foundation suggests that price movements are likely to exceed initial estimates.*

NATGAS Risky Short! Sell!
Hello,Traders!
NATGAS is about to retest
A horizontal resistance
Of 3.024$ from where
We will be expecting
A local bearish correction
Sell!
Like, comment and subscribe to help us grow!
Check out other forecasts below too!

Natural Gas | Oil | Dollar | Silver | Gold Price ForecastNatural Gas | Oil | Dollar | Silver | Gold Price Forecast
AMEX:USO Oil Stock Forecast
TVC:DXY US dollar Stock Forecast
Gold OANDA:XAUUSD Stock Forecast
Silver OANDA:XAGUSD

US Nat-Gas Poised to Rally on Rising Demand for HeatingTightening supplies, fluctuating inventories, and volatile geopolitics present intriguing risk management and trading possibilities in US Liquified Natural Gas ("US LNG") markets.
Colder weather forecasts, robust LNG exports, and Europe's increasing dependence on US LNG continues to reshape global energy trade.
US LNG PRICES REBOUND IN NOVEMBER ON IMPROVING DEMAND OUTLOOK
Henry Hub Natural Gas prices are up 9.2% month-to-date supported by lower output, colder weather forecasts, higher European gas prices (Dutch TTF), and increased feed gas to US LNG facilities.
A supply disruption stemming from Hurricane Rafael halted 16% of US LNG production in the Gulf of Mexico. However, production quickly recovered with the hurricane dissipating.
Weather forecasts have fluctuated, creating demand uncertainty. While warmer-than-expected November forecasts briefly pulled prices back, they failed to reverse the overall uptrend.
European gas prices are spiking driven by colder weather forecasts, reduced wind power generation, & lower Norwegian gas supplies. Since the start of this month, TTF has climbed 15.5% reaching its highest level since November last year. The increase in Dutch TTF prices added upward pressure.
Colder European forecasts have redirected LNG shipments to the region. US LNG export activity also surged, with daily feed gas flows to export plants hitting a 10-month high on 15/Nov.
Exports to seven major LNG facilities averaged 13.3 billion cubic feet per day (bcfd) in November, up from 13.1 bcfd in October, reflecting strong international demand.
Meanwhile, natural gas production in the Lower 48 states fell to 100.3 bcfd in November from 101.3 bcfd in October, further tightening supply.
Source: EIA
Over the past four weeks, storage injections exceeded the five-year average, reversing a 14-week streak (12/Jul-11/Oct) of below-average builds.
While inventories may rise briefly, the first withdrawals of the winter season are approaching. Initial draws might be modest, but demand is expected to strengthen as winter progresses.
US LNG EXPORTS SURGE AS EUROPE SCRAMBLES TO REPLACE RUSSIAN IMPORTS
Since the start of the Russia-Ukraine conflict, the EU has sought alternative energy suppliers, relying heavily on the US, which accounted for 48% of EU LNG imports in H1 2024 (versus Russia's 16%). The US became the largest LNG exporter globally in 2023.
From 2018 through 2021, US LNG exports to Europe averaged around 15 million tons a year. In 2022 and 2023, they jumped to 55 million tons a year as European power generators scrambled to replace Russian gas by whatever means necessary.
Source: EIA
This trend is expected to continue as EIA expects US LNG export capacity to grow by 9.7 bcfd, to touch 24.4 bcfd by 2028.
In its latest short-term energy outlook , the EIA expects US LNG exports to grow by 1.7% YoY in 2024 and 14% YoY in 2025.
Source: EIA
So far in 2024, between Jan-Aug, US exports rose by 1.4% YoY.
A surge in natural gas exports to Europe, combined with the massive power demand from new AI data centers, could lead US LNG prices to rise. The EIA expects average Henry Hub prices to rise 33.6% to USD 2.9/MMBtu in 2025.
TRUMP’S RETURN TO PRESIDENCY PRESENTS A MIXED BAG FOR THE US LNG MARKET
Trump's re-election presents mixed implications for the US LNG market. While his policies could support the buildup of gas & LNG infrastructure, they might also curtail LNG exports to China.
Under President Biden, the US paused permits for new LNG projects (earlier this January) to assess environmental & economic impact. This raised concerns over a slowdown in US LNG exports. However, the Trump administration is expected to expedite LNG permits with fewer environmental restrictions.
Source: EIA
Trump’s policies could also revive protectionist measures, potentially intensify trade tensions with China. If Trump implements higher tariffs on Chinese goods, retaliatory tariffs on US LNG could follow, as seen during his first term in 2018-19. Since then, US LNG deliveries to China have plummeted since its high in 2021.
HYPOTHETICAL TRADE SETUP
CME Micro Henry Hub Natural Gas Futures are poised to rise amid growing heating demand into winter season and Europe's continued reliance on US LNG.
The options skew for Henry Hub Natural Gas Futures reached 30.69 on 18/Nov, up significantly from 6.66 on 03/Sep. This sharp rise signals growing bullish expectations, with calls becoming increasingly expensive relative to puts.
Source: CME Group
US Nat Gas January Futures Contract trades at USD 3.182/MMBtu which is 21.6% below the five-year average.
Amid the fundamental forces at play, this paper posits a hypothetical trade setup of long CME Micro Henry Hub Natural Gas January Futures Contract (expiring on 26/Dec) at USD 3.150/MMBtu with a stop at USD 2.840/MMBtu and target at USD 3.60/MMBtu resulting in a reward-to-risk ratio of 1.45x. Each Micro Henry Hub Nature Gas Futures contract has 1,000 MMBtu
Over the past five years, Henry Hub prices typically declined from mid-November to year-end. The rapid surge in US LNG exports to Europe, now nearly half of the continent’s imports, is expected to offset any moderation in US heating demand.
Standard Henry Hub Futures can be used in the same way as the Micro Henry Hub Futures to express a bullish outlook on the US LNG market.
Unlike the standard CME Henry Hub Natural Gas Futures contract, the micro contract requires a margin of USD 258/lot as of 19th November 2024.
• Entry: USD 3.150/MMBtu
• Target: USD 3.600/MMBtu
• Stop-Loss: USD 2.840/MMBtu
• Profit at Target: USD 450/lot
• Loss at Stop: USD 310/lot
• Reward-to-Risk Ratio: 1.45x
MARKET DATA
CME Real-time Market Data helps identify trading set-ups and express market views better. If you have futures in your trading portfolio, you can check out on CME Group data plans available that suit your trading needs tradingview.com/cme .
DISCLAIMER
This case study is for educational purposes only and does not constitute investment recommendations or advice. Nor are they used to promote any specific products, or services.
Trading or investment ideas cited here are for illustration only, as an integral part of a case study to demonstrate the fundamental concepts in risk management or trading under the market scenarios being discussed. Please read the FULL DISCLAIMER the link to which is provided in our profile description.

Natural Gas Sell orderIf Trump is installed at the white house then the war between Ukraine and Russia will come to an end.
Also the European parties will realiza that the problem with socialism is that you eventually run out of other people's money.
Peace and a good cooperation with Russia will be the key for a wealthy economy, because these days people are with the back against the wall with this insane prices of everything.
When this day of peace comes we should expect lower gas prices. Lets hope for the best.

NATGAS: Bears Will Push
Balance of buyers and sellers on the NATGAS pair, that is best felt when all the timeframes are analyzed properly is shifting in favor of the sellers, therefore is it only natural that we go short on the pair.
❤️ Please, support our work with like & comment! ❤️

NG1! SHORT FROM RESISTANCE
Hello, Friends!
We are now examining the NG1! pair and we can see that the pair is going up locally while also being in a uptrend on the 1W TF. But there is also a powerful signal from the BB upper band being nearby, indicating that the pair is overbought so we can go short from the resistance line above and a target at 2.135 level.
✅LIKE AND COMMENT MY IDEAS✅

NATGAS Set To Fall! SELL!
My dear friends,
Please, find my technical outlook for NATGAS below:
The price is coiling around a solid key level -2.837
Bias - Bearish
Technical Indicators: Pivot Points Low anticipates a potential price reversal.
Super trend shows a clear sell, giving a perfect indicators' convergence.
Goal - 2.760
About Used Indicators:
The pivot point itself is simply the average of the high, low and closing prices from the previous trading day.
———————————
WISH YOU ALL LUCK

NATGAS Support Ahead! Buy!
Hello,Traders!
NATGAS is going down to
Retest the horizontal support
Of 3.09$ and as we are
Locally bullish biased
We will be expecting a
Local bullish rebound
Buy!
Comment and subscribe to help us grow!
Check out other forecasts below too!

Triangle in gasI think there will be a way out of the triangle downwards. however, we look beyond the upper and lower borders of the triangle.

Natural GasNatural Gas
Completed " 12345 " Impulsive Waves
Fibonacci Level - 261.80%
RSI - Divergence
Double Top as an Corrective Pattern in Short Time Frame
Rejection from Point of Interest
