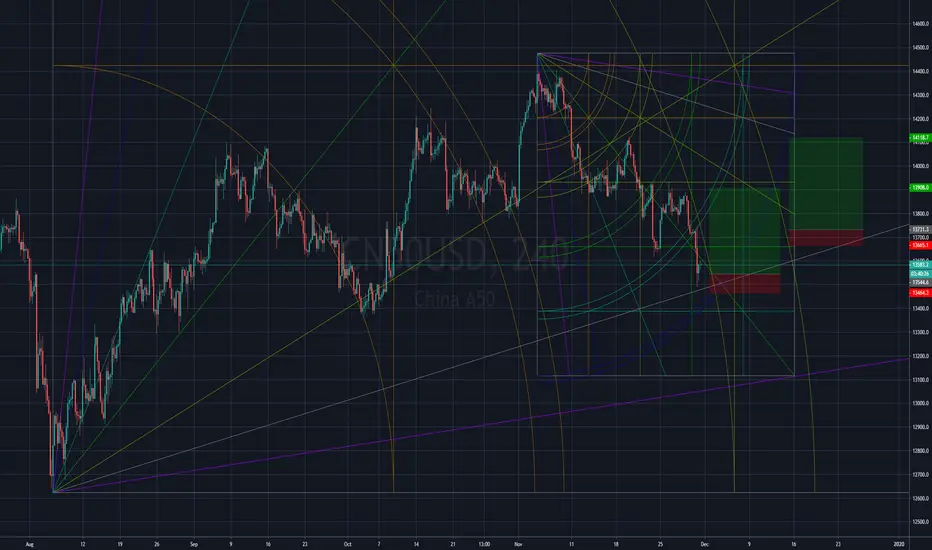
expect the big fall, CN50USDOANDA:CN50USD
at D time fame, current the time duration already go through and consumed so many days and could be recognize as wave 5, then the ABC should coming
CHINA50 trade ideas

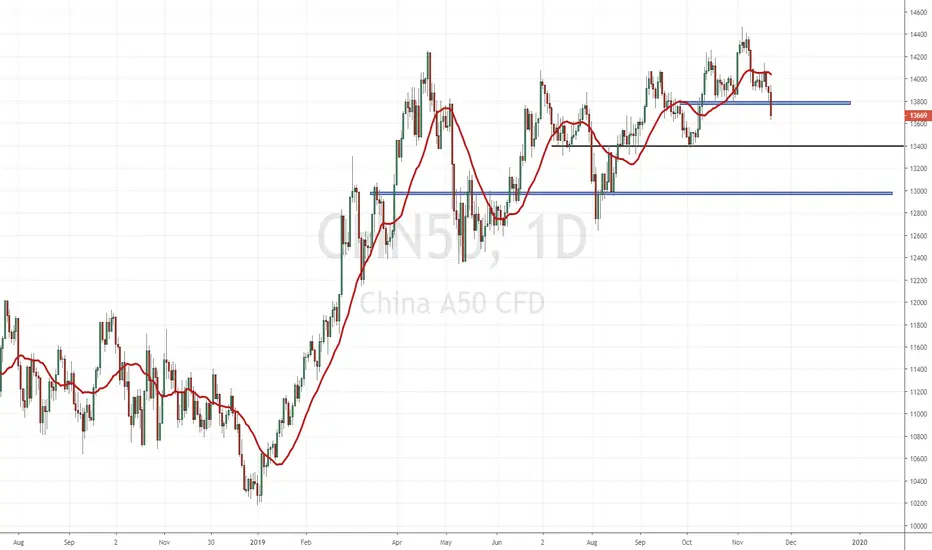
Institutional Supply for the CHN50Dear Traders,
Due to demand, I'll upload a few chart ideas beyond the forex markets. Besides the previous post about the DAX, the CHN50 is also looking good for a weekly pullback from Weekly and Daily Supply, both breaking a clean bullish trend to the downside.
The same gameplan is used as for the DAX, which is to show patience and see price-action move a bit higher towards the end of the week before a solid correction in the start of the new year. The Daily chart can be used nicely to spot reversal zones inside of this weekly supply zone, besides that the intra-day charts such as the 1hour and 4hour chart will be applied to create a full breakdown for the CHN50.
Have a good one.

CN50USD -Ascending triangle formationChina 50 creating a Ascending triangle formation, watch out for divergences going ahead on RSI and price action. Also, ROC over 0 In the positive direction may encourage upwards trend and otherwise in case of sub zero.
Watch out for trends on movements
We are approaching climax and breakout zone and in the Set up stage now . Interestingly, on Daily charts, CQQQ, the technology index for CQQQ tried to make an upward move but came back in zone too. but approaching climax zone. It will nice to see how they all develop going ahead.
Look out for more in this space
If you like what you read, please share a thumbs up !
Cheers

Flood Gate is Open NowThere are still some uncertainty over US - China trade agreement especially in intellectual property, technology transfer and the human rights issue in Hong Kong. These are challenges that would take a longer time to iron out but eventually some form of agreement would be reached, imo.
As seen on the 4H chart, price action is on a bullish trend with minor correction on the way. This would be opportunity for buyers who missed earlier.
1. It breaks out of 14099 resistance level and continue to charge higher.
2. It corrects towards the bullish trend line (green) and then rebound.
Note - if price breaks down the bullish trend line, buying ceases till we examine the price action further. Though this can possibly happen but I doubt the probability of it happening now.


Too big to fail - CN50www.caixinglobal.com
Billions of dollars will start to flow into this index , allowing more foreign investors to participate in it. This is good news for all as news of China opening up its capital market is moving in leaps and bounds.
Some of us may missed the bottom when it was at 10,000 in 2018 but no point crying over spilt milk. If the weekly top at 14,835 is to be hit again and beyond, then, that is another 800+ points to profit from.
See you at the TOP


China 50 Reversal PatternThe daily chart of the China 50 gave us a reversal trigger on a Friday. Going forward this week would ideally like to see how the market opens to see if it can give us a pullback.
The market structure is apparent. Higher lows and higher highs. We hit a resistance and from here the higher lows (uptrend) began to weaken.
From here, we created and confirmed our first lower high with the break of the neckline on the head and shoulders pattern.
I would watch to see how price reacts at the 13400 zone, but main target would be 13000.


China A50 - pushing towards key support levelsLong OANDA:CN50USD , Like I mentioned in my previous posts, price has formed a higher high and is on its way to test the support levels, as per the trend line. Price hit the support line and closed higher!
Look at the RSI. key is to look at price making higher moves and change in RSI back upwards after finding support in the Green zone (in the center)
IF the RSI support is breached, then look for other time frames, as price could be indicating break in upward trend that's been forming.
Watch out for this space for more action, day to day!
Please share a thumbs up if you like what you see and share a comment on this!
Cheers

China A50, longChina A50 gave a buy signal on Nov 1st 2019 on day charts, as indicated on charts.
As we see now, price has formed a higher high and we will deep dive into the hourly and monthly charts for cues.
Look out for retracements and if price continues to make a higher Low, then treat it an entry point to buy more
Adding my earlier studies for different perspectives on charts
If you like what you see, please share a thumbs up and a comment in the section below
If there is any specific chart to be reviewed, share the details below and I will try and revert at the earliest
Lets discuss!
Cheers

CHINA A50...Looks good for upmoveOANDA:CN50USD on weekly charts look good for up move
Some of the important levels are marked on the charts and look out for a few more higher highs and retracements to be higher lows.
Keep an eye on the RSI too. We have not been on the OVERSOLD space and holding up the middle zone
If you like what you see, please share a thumbs up!


