16-04-2025This chart contains my analysis and key observations for today's trading session. All drawings and indicators reflect my current view of the market as of today. The purpose of this publication is to keep a record of my analysis and review it later for learning and improvement. No investment advice is provided.
German DAX 30 Index
24,134.49EURR
+183.30+0.77%
As of today at 13:15 GMT
EUR
No trades
DE30 trade ideas

11-04-2025This chart contains my analysis and key observations for today's trading session. All drawings and indicators reflect my current view of the market as of today. The purpose of this publication is to keep a record of my analysis and review it later for learning and improvement. No investment advice is provided.

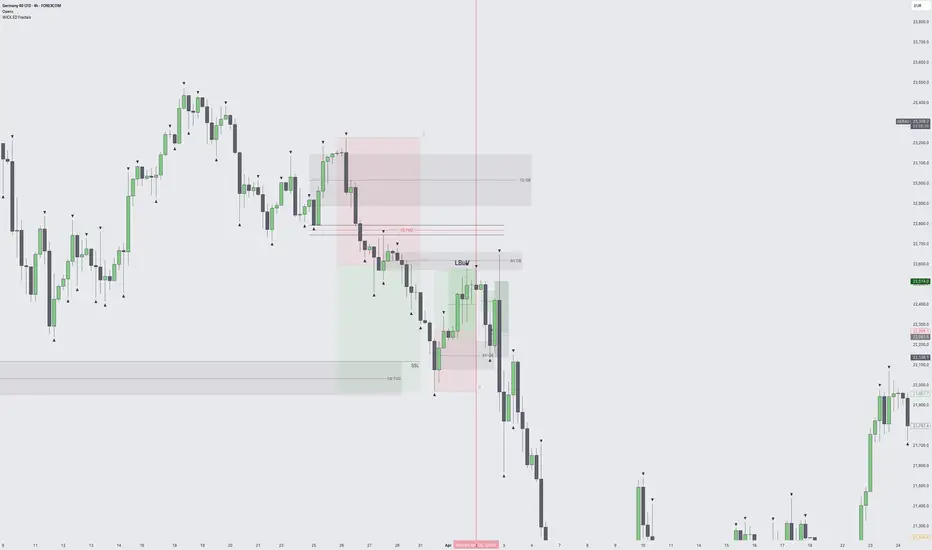
02-04-2025This chart contains my analysis and key observations for today's trading session. All drawings and indicators reflect my current view of the market as of today. The purpose of this publication is to keep a record of my analysis and review it later for learning and improvement. No investment advice is provided.
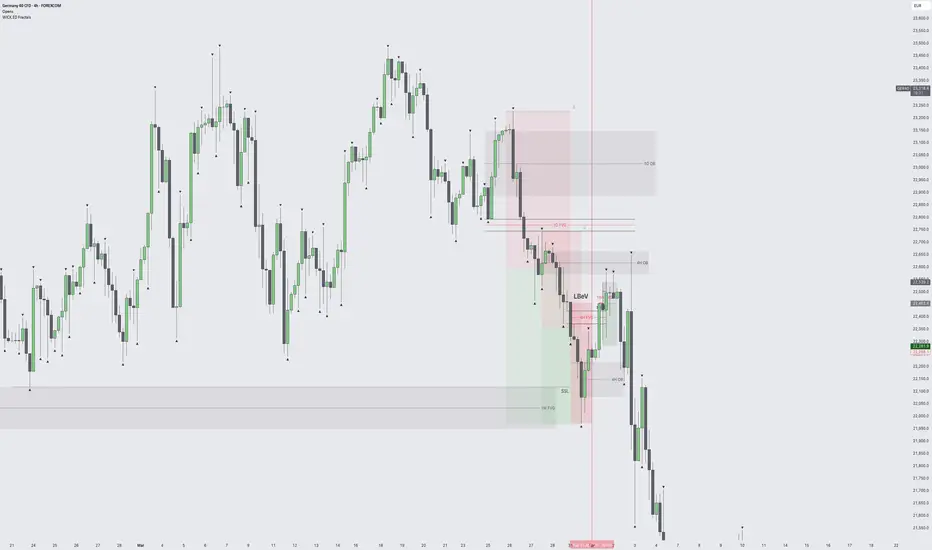
01-04-2025This chart contains my analysis and key observations for today's trading session. All drawings and indicators reflect my current view of the market as of today. The purpose of this publication is to keep a record of my analysis and review it later for learning and improvement. No investment advice is provided.
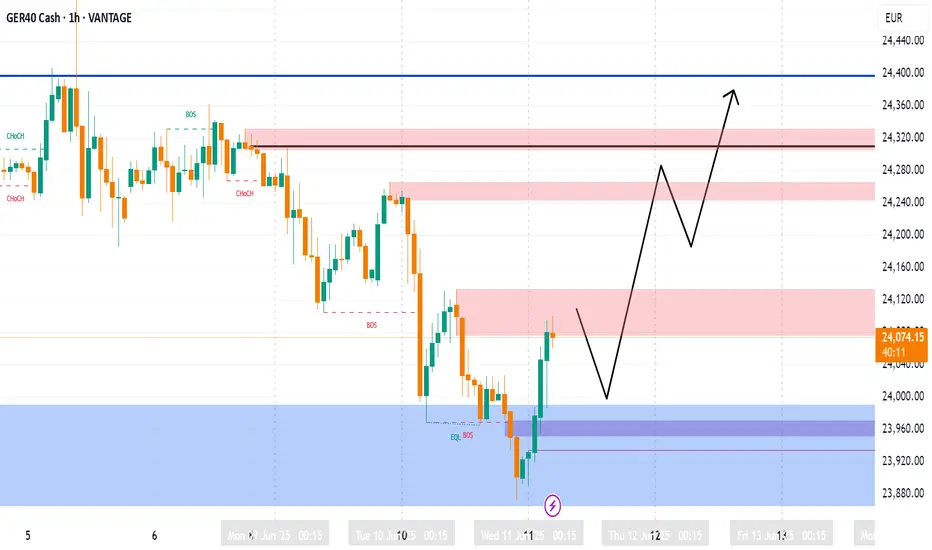
The calm before the storm for Germany to 25,113W Formation formed on Germany and the price rallied up super well.
3/4s to the take profit, but then the inevitable consolidation phase kicked in and we've been waiting for the next breakout for when it breaks above the box.
So all other elements and conditions stay the same, we just need to be patient and let it run it's course.
Price>20 and 200
Target 25,113
Disclosure: I am part of Trade Nation's Influencer program and receive a monthly fee for using their TradingView charts in my analysis.

17-06-2025 dayThis chart contains my analysis and key observations for today's trading session. All drawings and indicators reflect my current view of the market as of today. The purpose of this publication is to keep a record of my analysis and review it later for learning and improvement. No investment advice is provided.
explaining of my analysis for 17-06-2025 day

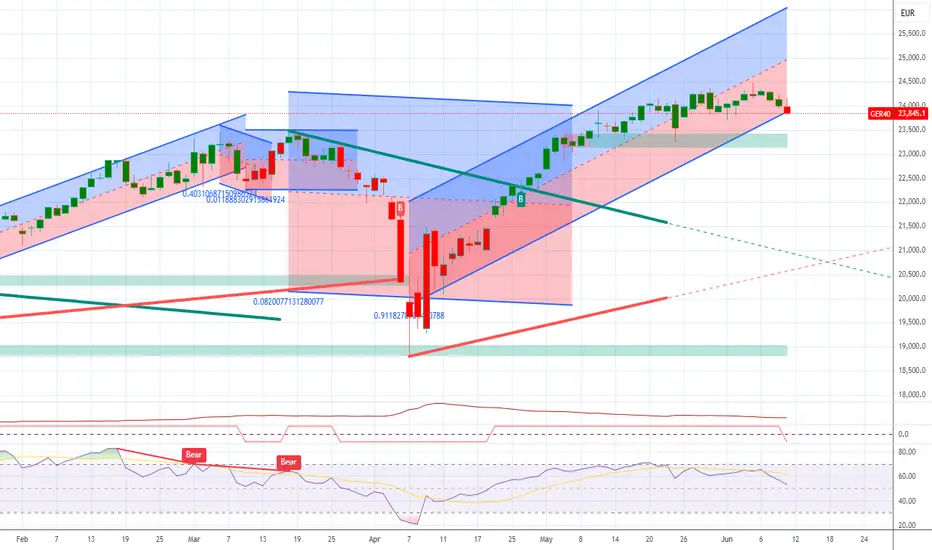
"Downside DAX" is what we will call it in July?Looking at the technical picture purely, we can see that weakness is starting to kick in. Will July be a negative month for DAX? Let's have a look.
XETR:DAX
Let us know what you think in the comments below.
Thank you.
77.3% of retail investor accounts lose money when trading CFDs with this provider. You should consider whether you understand how CFDs work and whether you can afford to take the high risk of losing your money. Past performance is not necessarily indicative of future results. The value of investments may fall as well as rise and the investor may not get back the amount initially invested. This content is not intended for nor applicable to residents of the UK. Cryptocurrency CFDs and spread bets are restricted in the UK for all retail clients.

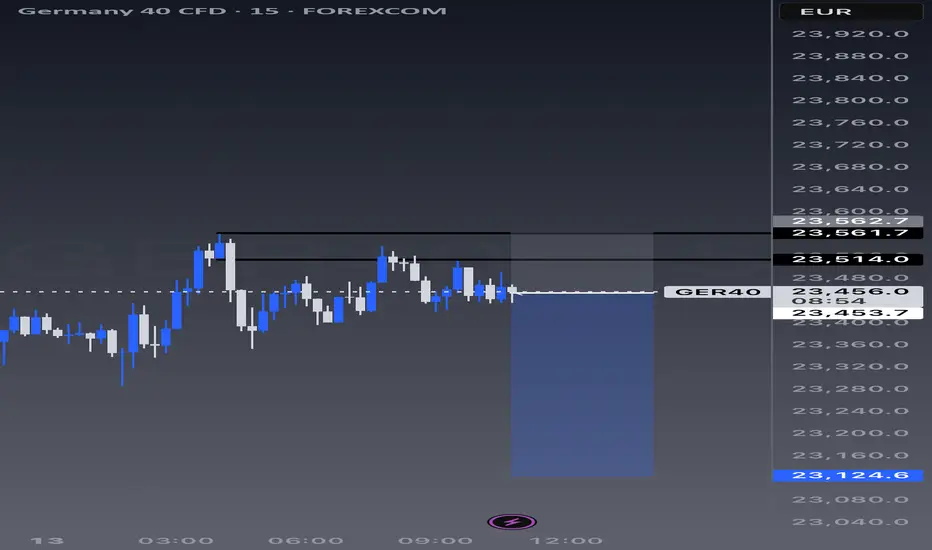
DAX: Local Bearish Bias! Short!
My dear friends,
Today we will analyse DAX together☺️
The recent price action suggests a shift in mid-term momentum. A break below the current local range around 23,509.95 will confirm the new direction downwards with the target being the next key level of 23,389.15.and a reconvened placement of a stop-loss beyond the range.
❤️Sending you lots of Love and Hugs❤️

DAX INTRADAY resistance retest at 23690Trend Overview:
The DAX equity index remains in a bearish trend, with recent price action forming a corrective pullback within that prevailing structure.
Key Resistance Level:
23690: This level marks a significant previous intraday consolidation zone and acts as a key resistance barrier.
A rally into this zone is likely to face selling pressure unless buyers gain decisive control.
Bearish Scenario (Primary Bias):
A rejection from 23690, particularly if supported by bearish candlestick patterns or volume confirmation, would align with the broader downtrend.
This would set up potential downside targets at:
23200 – Initial support level.
23035 – Intermediate support.
22860 – Long-term support zone.
Bullish Scenario (Invalidation):
A confirmed breakout and daily close above 23690 would invalidate the current bearish bias.
This would open the path for a retest of:
23900 – Short-term resistance.
24080 – Higher resistance zone and potential trend reversal confirmation.
Conclusion:
The DAX is currently in a corrective phase within a bearish trend. A failure to break above 23690 would reinforce the downside setup toward 23200 and beyond. However, a daily close above 23690 would shift the technical outlook to bullish in the short term, with scope for a continuation higher toward 24080. Traders should monitor price behavior at 23690 closely for directional confirmation.
This communication is for informational purposes only and should not be viewed as any form of recommendation as to a particular course of action or as investment advice. It is not intended as an offer or solicitation for the purchase or sale of any financial instrument or as an official confirmation of any transaction. Opinions, estimates and assumptions expressed herein are made as of the date of this communication and are subject to change without notice. This communication has been prepared based upon information, including market prices, data and other information, believed to be reliable; however, Trade Nation does not warrant its completeness or accuracy. All market prices and market data contained in or attached to this communication are indicative and subject to change without notice.

the essential systemweekly candle formation
basic to advance structure
internal range liquidity(buyside)
discount and premium range
key zones(poc)

#004 DAX GERMANY 40: LONG Opportunity
GERMANY 40 – Possible Daily Reversal Starting: LONG on Strategic Support
Hello, I am Trader Andrea Russo, Founder of the SwipeUP Élite FX Method, and today I want to point out this investment on Germany 40 (DAX), in a long configuration from the 23,345 area.
🔍 Technical Context
In recent days, the DAX has undergone a strong correction that has brought the price from 24,800 to test the lows in the 23,200 area. This area corresponds to a long-term daily support level, already used in the past for institutional accumulations.
The price generated a strong bearish spike right at the opening of the cash session, but without closing below the previous lows. This behavior is often indicative of a pre-reversal bearish manipulation.
Confirming this scenario, a double bottom pattern has formed with positive divergence on the 8H and daily cyclical oscillators. In addition, volumes are growing right on the support: a typical signal of an invisible accumulation phase by institutional operators.
✅ Trade Strengths
Daily static support confirmed at 23,200–23,300, already defended several times in the past.
Manipulative spike evident in the first hour of cash opening, followed by rejection of the lows.
Bullish divergence on the cyclical indicators (WT_CROSS) in H8.
Favorable risk/reward ratio (~3.6:1), with well-defined technical stop loss.
Volatility under control: the VIX is stable and the US session opened without a selloff.
Neutral/positive macro environment: weak euro, expectations of monetary easing, low pressure on bonds.
Derivatives sentiment favorable: open interest rising in the 23,300–23,400 area on DAX futures.
🎯 Operating Levels
ENTRY: 23,345
STOP LOSS: 23,170
TAKE PROFIT: 24,007
📌 This positioning allows you to operate with limited risk and a realistic objective, perfectly compatible with standard technical movements on the German index in 2–3 days.
⏱️ Expected Timings
First directional candle expected within 8–16 hours (1–2 H8 candles).
Estimated duration of the trade: between 48 and 72 hours to reach the target.
🧠 Operating Conclusion
The long investment on DAX from 23,345 represents one of the clearest technical configurations seen in the last week on European indices.
The simultaneous presence of cyclical signals, manipulation, structure and static support offers a high probability of success.
The final target at 24,007 is technically and statistically achievable with rigorous management.
💬 Leave a like if you want to receive the 8H analysis update and comment your vision on Germany 40.
🔔 Follow the profile to not miss the next multi-asset updates!

Technical Weekly AnalysisStart your week by identifying the key price levels and trends.
The SpreadEx Research team has analysed the most popular markets, including stocks, indices, commodities & forex.
--------------------------------------------------------------------------------------------------------------
Analysis
Germany 40 remains in a bullish trend but is currently in a correction phase. It is trading at 23,615, below its VWAP of 23,997, which suggests a potential loss of momentum. RSI at 45.9 reinforces the subdued tone. Support is at 23,448 and resistance is at 24,546.
UK 100 continues in a bullish trend and is firmly in an impulsive phase - pushing into record highs. Price is at 8,893, slightly above the VWAP of 8,815, showing continued strength. The RSI at 65.2 supports bullish momentum. Support lies at 8,730, while resistance has edged up to 8,900.
Wall Street maintains a bullish trend but is experiencing a corrective phase. It is priced at 42,333, just below the VWAP of 42,350. RSI at 51.5 indicates a balanced market sentiment. Support remains at 41,830 and resistance is at 43,064.
Brent Crude is in a bullish trend with a big impulsive phase underway. It's trading at 7,299, well above the VWAP of 6,666, suggesting very strong upward momentum. The RSI of 68.7 further supports this view. Support is at 5,934 and resistance is at 7,399.
Gold has entered a possible bullish breakout, moving above the prior sideways range. Trading at 3,416, it is comfortably above the VWAP of 3,347. RSI at 59.8 points to positive momentum. Support is seen at 3,254, with resistance at 3,440.
EUR/USD is consolidating within a bullish trend. The price at 1.1578 is well above the VWAP of 1.1420, showing underlying strength. The RSI at 65.5 suggests sustained buying interest. Support is at 1.1254, and resistance remains at 1.1579.
GBP/USD continues its bullish trend in an impulsive phase. Price is at 1.3581, just above the VWAP of 1.3530. RSI at 59.2 indicates stable bullish momentum. Support is at 1.3448, with resistance at 1.3610.
USD/JPY remains in a corrective phase of its bearish trend. It trades at 144.09, nearly matching the VWAP of 144.00. RSI at 49.3 shows neutral sentiment. Support is at 142.41, and resistance stands at 145.44.

Weekly Idee with Pinex Capital as BrokerHey guys the weekly idea I would call the marked zone a conflict zone so I would only trade it after the reaction I have the lower liquidity in mind that we have left behind depending on where we break out you could also go long in reaction to the zone but here the risk is higher
Until then Cheers Updates Follow...

GER 30 BUY ENTRYConfirmation of Buy
1. Change of Character on 15 min (CHoC)
2. There is a FVG below which needs to be filled
3. The FVG aligns with FIB entries
4. GER 30 needs to close the Gap 23745 so we buying till that closure of Gap


DAX H4 I Bullish Bounce OfBased on the H4 chart analysis, the price is approaching our buy entry level at 23,196.26, a pullback support that aligns with the 23.6 Fibonacci retracement.
Our take profit is set at 23,655.66, a pullback resistance.
The stop loss is placed at 22,911.69, a swing low support.
High Risk Investment Warning
Trading Forex/CFDs on margin carries a high level of risk and may not be suitable for all investors. Leverage can work against you.
Stratos Markets Limited (tradu.com ):
CFDs are complex instruments and come with a high risk of losing money rapidly due to leverage. 63% of retail investor accounts lose money when trading CFDs with this provider. You should consider whether you understand how CFDs work and whether you can afford to take the high risk of losing your money.
Stratos Europe Ltd (tradu.com ):
CFDs are complex instruments and come with a high risk of losing money rapidly due to leverage. 63% of retail investor accounts lose money when trading CFDs with this provider. You should consider whether you understand how CFDs work and whether you can afford to take the high risk of losing your money.
Stratos Global LLC (tradu.com ):
Losses can exceed deposits.
Please be advised that the information presented on TradingView is provided to Tradu (‘Company’, ‘we’) by a third-party provider (‘TFA Global Pte Ltd’). Please be reminded that you are solely responsible for the trading decisions on your account. There is a very high degree of risk involved in trading. Any information and/or content is intended entirely for research, educational and informational purposes only and does not constitute investment or consultation advice or investment strategy. The information is not tailored to the investment needs of any specific person and therefore does not involve a consideration of any of the investment objectives, financial situation or needs of any viewer that may receive it. Kindly also note that past performance is not a reliable indicator of future results. Actual results may differ materially from those anticipated in forward-looking or past performance statements. We assume no liability as to the accuracy or completeness of any of the information and/or content provided herein and the Company cannot be held responsible for any omission, mistake nor for any loss or damage including without limitation to any loss of profit which may arise from reliance on any information supplied by TFA Global Pte Ltd.
The speaker(s) is neither an employee, agent nor representative of Tradu and is therefore acting independently. The opinions given are their own, constitute general market commentary, and do not constitute the opinion or advice of Tradu or any form of personal or investment advice. Tradu neither endorses nor guarantees offerings of third-party speakers, nor is Tradu responsible for the content, veracity or opinions of third-party speakers, presenters or participants.

Sell idea on GER40After receiving multiple breakthroughs listening to The mental game of trading
I’m starting to realize that the more I document the more I’m able to resolve
When we resolve, we recognize patterns
And when recognize patterns were able to stop the downward spiral
I noticed when I get frustrated, I tend to throw my rules out of the window
But before this, I felt really calm. I was able to clean and get things done.
I sat down in front of my computer and started to realize that we made a massive move to the downside
I drew a fib from high to low and noticed that we’re getting close to the 38% pull back
On the overall move on the daily timeframe till the upside
So we’re catching a piece of the pull back and we’re also going to be waiting for confirmation for the big move up
Tracking his key not just on my trading journal but publishing these ideas
Bearish drop?DAX40 (DE40) is reacting off the pivot which acts as a pullback resistance and could drop to the overlap support.
Pivot: 23,758.06
1st Support: 23,381.73
1st Resistance: 24,078.12
Risk Warning:
Trading Forex and CFDs carries a high level of risk to your capital and you should only trade with money you can afford to lose. Trading Forex and CFDs may not be suitable for all investors, so please ensure that you fully understand the risks involved and seek independent advice if necessary.
Disclaimer:
The above opinions given constitute general market commentary, and do not constitute the opinion or advice of IC Markets or any form of personal or investment advice.
Any opinions, news, research, analyses, prices, other information, or links to third-party sites contained on this website are provided on an "as-is" basis, are intended only to be informative, is not an advice nor a recommendation, nor research, or a record of our trading prices, or an offer of, or solicitation for a transaction in any financial instrument and thus should not be treated as such. The information provided does not involve any specific investment objectives, financial situation and needs of any specific person who may receive it. Please be aware, that past performance is not a reliable indicator of future performance and/or results. Past Performance or Forward-looking scenarios based upon the reasonable beliefs of the third-party provider are not a guarantee of future performance. Actual results may differ materially from those anticipated in forward-looking or past performance statements. IC Markets makes no representation or warranty and assumes no liability as to the accuracy or completeness of the information provided, nor any loss arising from any investment based on a recommendation, forecast or any information supplied by any third-party.

Bearish drop off pullback resistance?GER40 has reacted off the resistance level which is a pullback resistance that lines up with the 38.2% Fibonacci retracement and could drop from this level to our take profit.
Entry: 23,897.39
Why we like it:
There is a pullback resistance level that lines up with the 38.2% Fibonacci retracement.
Stop loss: 24,321.37
Why we like it:
There is a pullback resistance level that aligns with the 78.6% Fibonacci retracement.
Take profit: 23,138.29
Why we like it:
There is a pullback support level.
Enjoying your TradingView experience? Review us!
Please be advised that the information presented on TradingView is provided to Vantage (‘Vantage Global Limited’, ‘we’) by a third-party provider (‘Everest Fortune Group’). Please be reminded that you are solely responsible for the trading decisions on your account. There is a very high degree of risk involved in trading. Any information and/or content is intended entirely for research, educational and informational purposes only and does not constitute investment or consultation advice or investment strategy. The information is not tailored to the investment needs of any specific person and therefore does not involve a consideration of any of the investment objectives, financial situation or needs of any viewer that may receive it. Kindly also note that past performance is not a reliable indicator of future results. Actual results may differ materially from those anticipated in forward-looking or past performance statements. We assume no liability as to the accuracy or completeness of any of the information and/or content provided herein and the Company cannot be held responsible for any omission, mistake nor for any loss or damage including without limitation to any loss of profit which may arise from reliance on any information supplied by Everest Fortune Group.


DAX INTRADAY at pivotal level Trend Overview:
The DAX Index remains in a bullish trend, supported by a series of higher highs and higher lows. The broader structure continues to favour the upside, although recent intraday price action suggests a sideways consolidation, signalling a potential pause within the prevailing uptrend.
Key Support and Resistance Levels:
Support: 23680 (key pivot), followed by 23445 and 23200
Resistance: 24570 (initial), then 24770 and 25000
Technical Outlook:
A pullback toward the 23680 support—which aligns with the prior consolidation zone—could offer a buying opportunity if price action confirms a bullish reversal from that level.
A sustained break above 24570 would likely accelerate bullish momentum, targeting 24770 and 25000 over the medium term.
Conversely, a daily close below 23680 would invalidate the bullish bias, exposing the index to a deeper retracement toward 23445 and potentially 23200.
Conclusion:
While the broader DAX trend remains bullish, traders should watch for price behavior around the 23680 level. A bounce could resume the uptrend toward 25000, but a confirmed breakdown would shift the short-term bias to bearish, signaling a deeper correction.
This communication is for informational purposes only and should not be viewed as any form of recommendation as to a particular course of action or as investment advice. It is not intended as an offer or solicitation for the purchase or sale of any financial instrument or as an official confirmation of any transaction. Opinions, estimates and assumptions expressed herein are made as of the date of this communication and are subject to change without notice. This communication has been prepared based upon information, including market prices, data and other information, believed to be reliable; however, Trade Nation does not warrant its completeness or accuracy. All market prices and market data contained in or attached to this communication are indicative and subject to change without notice.

DAX: Move Up Expected! Long!
My dear friends,
Today we will analyse DAX together☺️
The market is at an inflection zone and price has now reached an area around 23.976.69 where previous reversals or breakouts have occurred.And a price reaction that we are seeing on multiple timeframes here could signal the next move up so we can enter on confirmation, and target the next key level of 24.050.29. Stop-loss is recommended beyond the inflection zone.
❤️Sending you lots of Love and Hugs❤️

GER 40 (DAX) LONG TRADE IDEAGER40 (DAX) – Long Trade Idea
Timeframes:
Quarterly Bias: Bullish
Entry Execution: 1HR–4HR
Market Narrative:
The Quarterly outlook on GER40 remains bullish, and recent price action has confirmed alignment with this narrative:
Sell-side liquidity has been swept.
A clear bullish market structure shift has occurred.
Price is now likely to retest a Bullish Breaker Block near 23,995—an ideal area to look for long entries.
This setup presents a high-probability continuation move to the upside, targeting premium-side inefficiencies and liquidity.
Entry Zone:
🟢 Buy Zone: 23,995
Retest of the Bullish Breaker Block
Look for:
A bullish FVG or displacement candle on 1HR/4HR
BOS (Break of Structure) confirmation on lower timeframes
Entry after internal liquidity sweep (e.g., stop run below previous low)
Stop Loss:
🔴 SL: 23,900
Below Bullish Breaker and recent structure low
Invalidation point of the bullish thesis
Take Profit Levels:
TP1 – 24,265
🎯 Return to previous structural high & imbalance fill
TP2 – 24,360
🎯 Extended move into premium + likely liquidity draw above highs
Risk Management:
📊 Risk: 1% per trade
Maintain position sizing discipline
Use partial profits at TP1 and trail stop to breakeven or structure for TP2
Confluences:
Quarterly bullish bias remains intact
Sell-side liquidity sweep provides fuel for a bullish move
Market structure shift confirms smart money accumulation
Bullish Breaker Block in discounted territory presents a key entry opportunity
Price likely to seek buy-side liquidity in premium
Execution Plan:
Wait for price to return to 23,995 zone
Watch for confirmation on 15min–1HR:
Internal liquidity sweep
Bullish BOS or FVG
Entry on bullish displacement
Manage trade dynamically based on market behavior at TP1