How to prepare a session and generate ideas - Todays NY SessionIn this video i demonstrate how i prepare a session with my heat map analysis template, using SB Style signals, MTF approach and market profile. I go through the current price action and setup of DXY, Silver, Gold, WTI, NAS, S&P and DJ30
Dow Jones Industrial Average Index
45,002.60USDR
+74.40+0.17%
As of today at 04:20 GMT
USD
No trades
US30 trade ideas

Dow Jones Slides on Tariff News – What’s Next?US30 – Market Overview
US30 dropped nearly 600 points yesterday ahead of the announcement of new tariffs, adding pressure to the broader market.
Technical Outlook
Bearish Scenario:
While price remains below 44170, bearish momentum is favored, targeting 43960.
A confirmed break below 43960 would likely extend the decline toward 43630.
Bullish Scenario:
A 1H close above 44170 would shift the bias to bullish, targeting 44360 and possibly 44470.
Support: 43960 – 43630
Resistance: 44360 – 44470

US30 TRADE IDEA 4 AUGUST 2025The US30 (Dow Jones Industrial Average) is showing signs of a near-term bearish bias after breaking down from its rising daily channel and rejecting at the 44,700–45,100 supply zone, which coincides with a key former support level now acting as resistance. From a Smart Money Concepts perspective, this zone represents a recent order block where institutional selling pressure originated, making it a high-probability area to look for short entries if price retests with bearish confirmation, such as a daily bearish engulfing candle, a long rejection wick, or a clear lower-high formation. The first major downside target lies around 43,062, aligning with an intermediate demand zone, with an extended target toward 42,500, where deeper demand and prior consolidation converge. Stops should be placed above 45,150 to invalidate the bearish setup. Conversely, if price drops into the 42,800–43,000 demand zone and shows strong bullish reversal patterns, there is scope for a tactical countertrend long back toward 44,700–45,100, provided that geopolitical and macro conditions turn supportive. Fundamentally, the market remains caught between optimism over potential Federal Reserve rate cuts later this year and uncertainty stemming from the Fed’s cautious, data-dependent stance. Geopolitical risks—particularly heightened tensions in the Middle East and ongoing U.S.–China trade friction—are adding to volatility and could weigh on global risk sentiment, especially if oil prices spike and inflation concerns reemerge. These risks, combined with political uncertainty in the U.S., favor selling into rallies until there is a clear shift in macro direction. Key events to monitor include upcoming Fed communications, developments in Middle East conflicts, and any major U.S.–China trade headlines, all of which could either reinforce the short bias or trigger a sentiment-driven reversal. For now, the preferred approach is to sell into strength near the supply zone with defined risk, manage positions closely around the 43,000 demand area, and remain flexible to flip bias if price action and fundamentals align for a reversal.

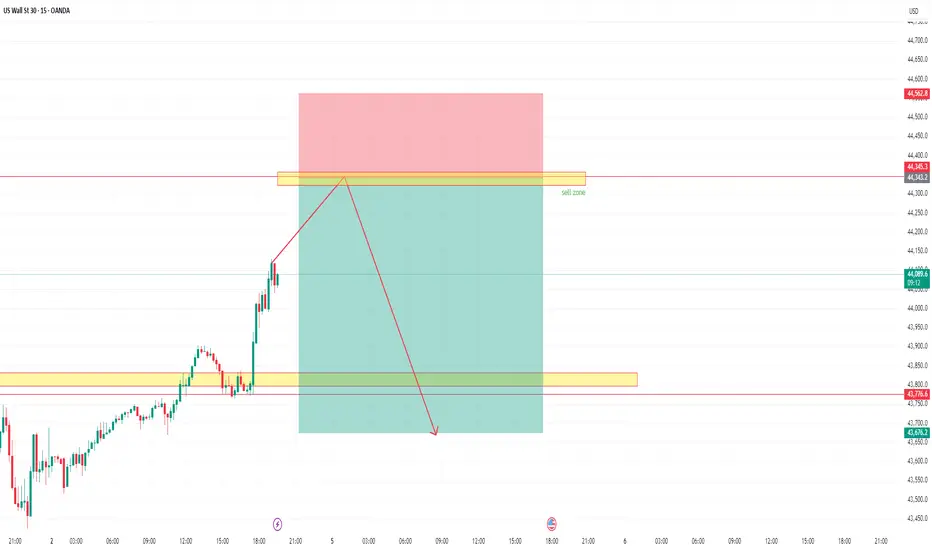
Dow Jones Potential DownsidesHey Traders, in today's trading session we are monitoring US30 for a selling opportunity around 44,300 zone, Dow Jones is trading in a downtrend and currently is in a correction phase in which it is approaching the trend at 44,300 support and resistance area.
Trade safe, Joe.

us30signal: sell (downtrend-H1)
setup: correction (wa to wb to wc)
confirmation:
1. fibo yes
2. snd yes
3. sbt yes
US30 Bullish Bias Builds on Fed and Earnings OptimismUS30 – Market Overview
The market is showing bullish momentum, supported by recent developments from the Federal Reserve and a strong corporate earnings season.
Technically, the price action suggests a continuation of the uptrend toward 44610.
🔻 However, bearish momentum may be triggered if the price breaks below 44170.
🔹 Resistance: 44360, 44610 – 44820
🔹 Support: 44170 – 43960 – 43630

DowJones key trading levelsKey Support and Resistance Levels
Resistance Level 1: 44700
Resistance Level 2: 44924
Resistance Level 3: 45130
Support Level 1: 43760
Support Level 2: 43477
Support Level 3: 43288
This communication is for informational purposes only and should not be viewed as any form of recommendation as to a particular course of action or as investment advice. It is not intended as an offer or solicitation for the purchase or sale of any financial instrument or as an official confirmation of any transaction. Opinions, estimates and assumptions expressed herein are made as of the date of this communication and are subject to change without notice. This communication has been prepared based upon information, including market prices, data and other information, believed to be reliable; however, Trade Nation does not warrant its completeness or accuracy. All market prices and market data contained in or attached to this communication are indicative and subject to change without notice.
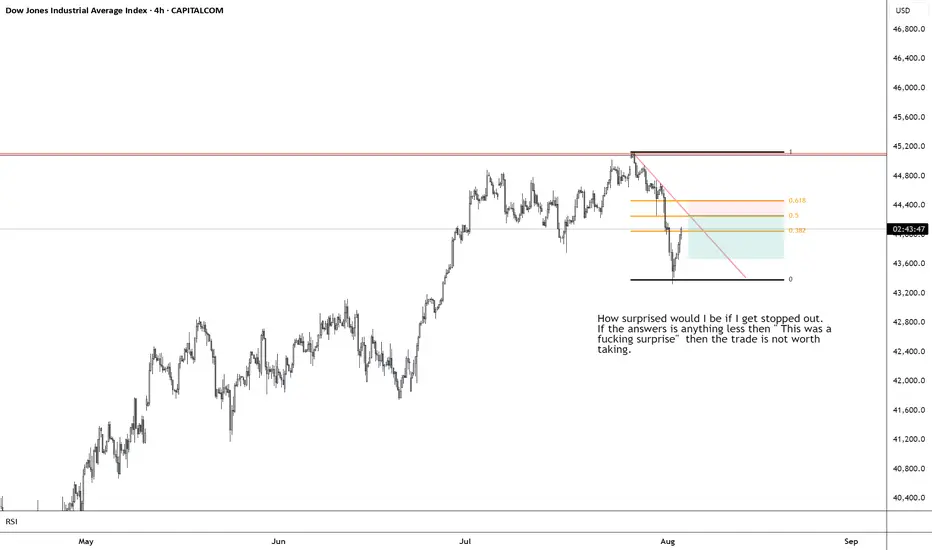
4H Analysis of Dow Jones | Selling Pressure Below Key Resistance4H Analysis of Dow Jones
🔸 Price is currently trading below a key resistance level and has yet to break above it.
🔻 If weakness persists, a bearish reversal toward lower support levels is likely.
🔹 A confirmed breakout above the resistance could open the path for further upside.
✅ Price reaction to this resistance will determine the next market direction.
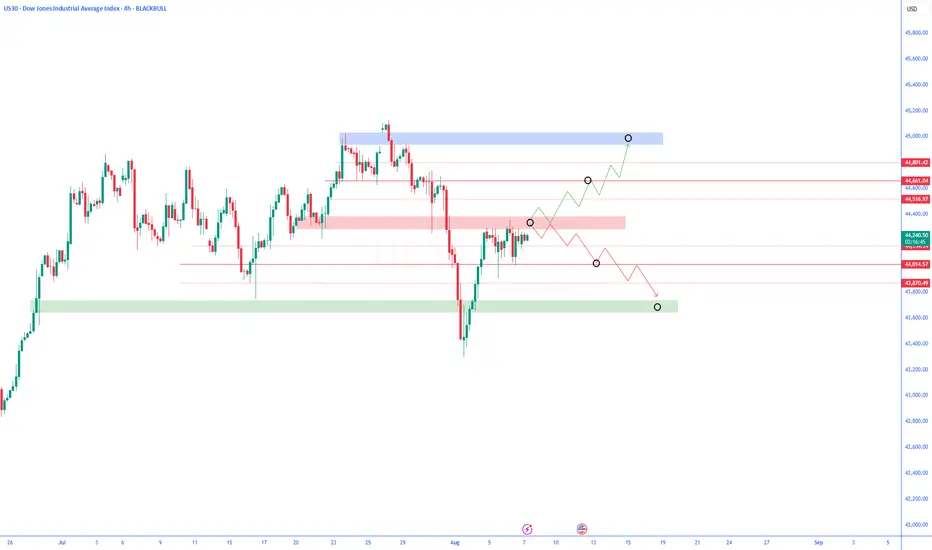

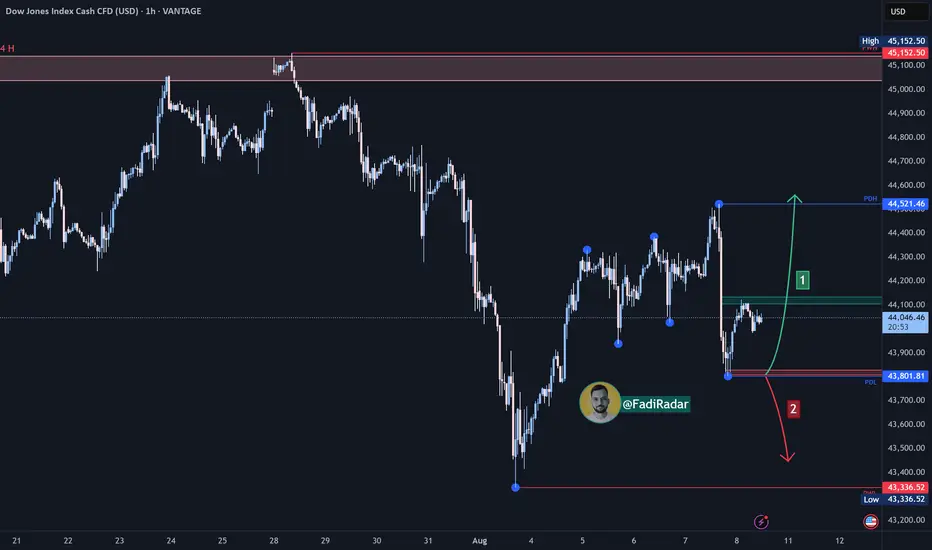
Dow Jones Index (US30 / Dow Jones) Analysis:The Dow Jones index is currently moving sideways and is trading near the $44,000 level.
🔻 Bearish Scenario:
If selling pressure leads to a break below the $43,800 area, the index may drop to test the $43,300 level, which is considered a critical support in the short term.
🔺 Bullish Scenario:
The price may test PDL (Previous Day Low) at $43,800 as a support zone and bounce upward. If the index breaks and holds above $44,100, this could lead to a continuation toward $44,520, and then to $45,000, a key resistance zone.
⚠️ Disclaimer:
This analysis is not financial advice. It is recommended to monitor the markets and carefully analyze the data before making any investment decisions.

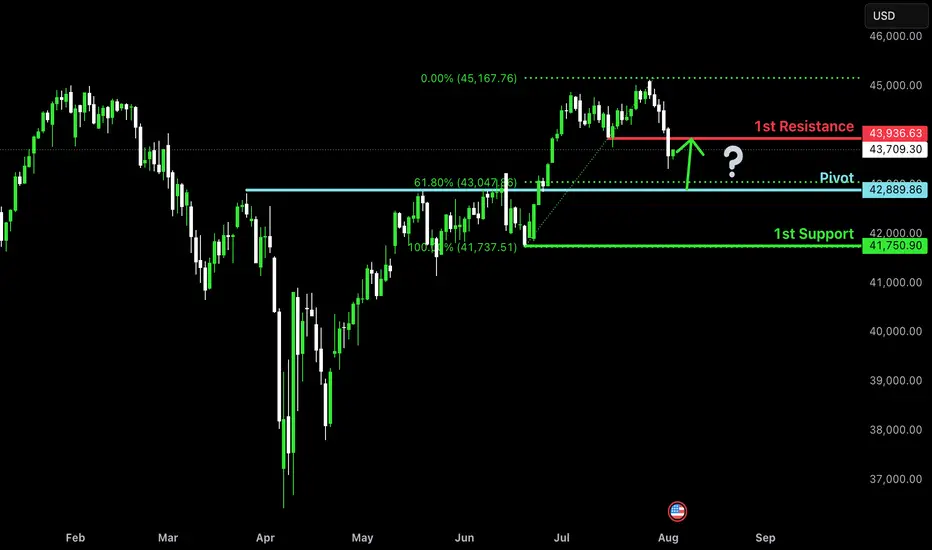
Falling towards pullback support?Dow Jones (US30) is falling towards the pivot and could bounce to the 1st resistance.
Pivot: 42,889.86
1st Support: 41,750.90
1st Resistance: 43,936.63
Risk Warning:
Trading Forex and CFDs carries a high level of risk to your capital and you should only trade with money you can afford to lose. Trading Forex and CFDs may not be suitable for all investors, so please ensure that you fully understand the risks involved and seek independent advice if necessary.
Disclaimer:
The above opinions given constitute general market commentary, and do not constitute the opinion or advice of IC Markets or any form of personal or investment advice.
Any opinions, news, research, analyses, prices, other information, or links to third-party sites contained on this website are provided on an "as-is" basis, are intended only to be informative, is not an advice nor a recommendation, nor research, or a record of our trading prices, or an offer of, or solicitation for a transaction in any financial instrument and thus should not be treated as such. The information provided does not involve any specific investment objectives, financial situation and needs of any specific person who may receive it. Please be aware, that past performance is not a reliable indicator of future performance and/or results. Past Performance or Forward-looking scenarios based upon the reasonable beliefs of the third-party provider are not a guarantee of future performance. Actual results may differ materially from those anticipated in forward-looking or past performance statements. IC Markets makes no representation or warranty and assumes no liability as to the accuracy or completeness of the information provided, nor any loss arising from any investment based on a recommendation, forecast or any information supplied by any third-party.
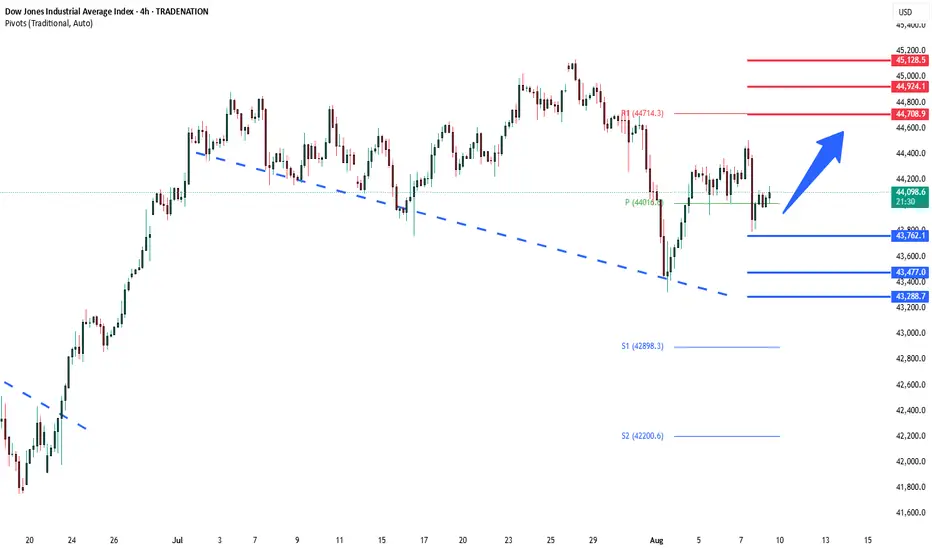
DowJones oversold bounce back supported at 44020Key Support and Resistance Levels
Resistance Level 1: 44708
Resistance Level 2: 44925
Resistance Level 3: 44128
Support Level 1: 44020
Support Level 2: 44760
Support Level 3: 43477
This communication is for informational purposes only and should not be viewed as any form of recommendation as to a particular course of action or as investment advice. It is not intended as an offer or solicitation for the purchase or sale of any financial instrument or as an official confirmation of any transaction. Opinions, estimates and assumptions expressed herein are made as of the date of this communication and are subject to change without notice. This communication has been prepared based upon information, including market prices, data and other information, believed to be reliable; however, Trade Nation does not warrant its completeness or accuracy. All market prices and market data contained in or attached to this communication are indicative and subject to change without notice.

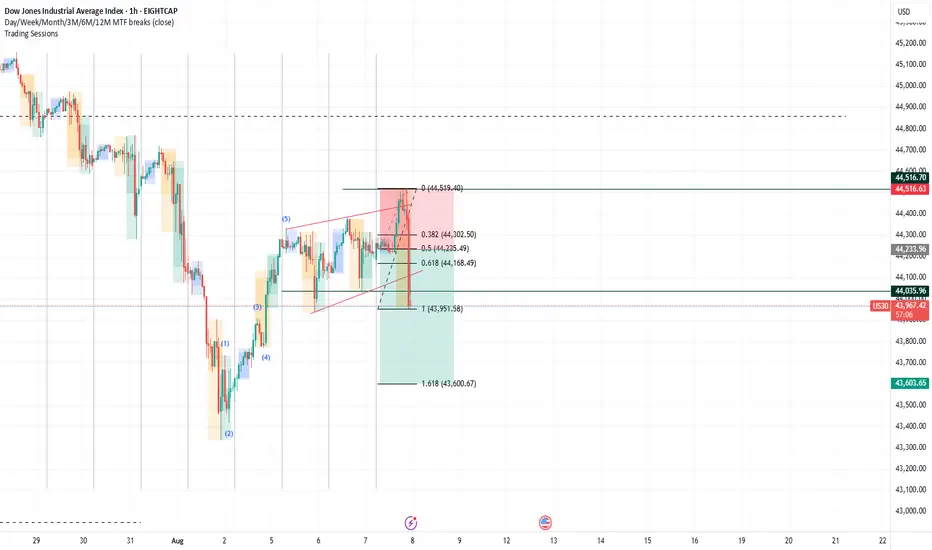
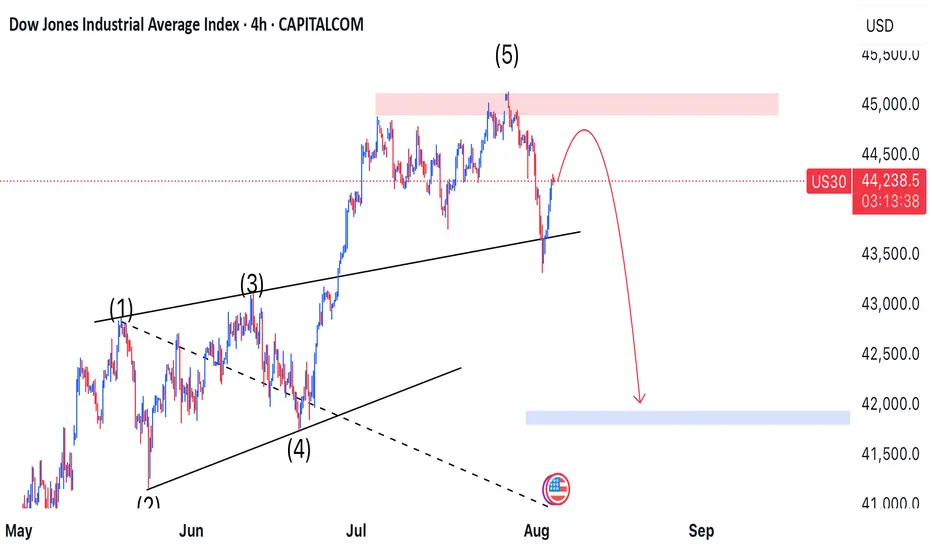
*US30: Fifth Wolfe Wave in Play—Correction Offers Prime Shorting📉 *
The US30 index has completed its **fifth Wolfe Wave**, initiating the expected downward move. While price is currently undergoing a corrective bounce, this retracement is shaping up to be a golden opportunity for sellers.
🔍 **Technical Breakdown**
- ✅ Wolfe Wave structure is confirmed, with wave 5 marking the turning point.
- 🔄 Current price action shows a **corrective pullback**, typical after the initial drop.
- 📌 Any upward movement is viewed as a **strategic entry point for short positions**.
🎯 **Target Zone**
We’re eyeing a descent toward the **41,700 level**, which aligns with the equilibrium line drawn between **waves 1 and 4**—a classic Wolfe Wave target.
⚠️ **Trade Insight**
This setup blends harmonic precision with tactical timing. As long as price remains below the wave 5 peak, the bearish bias holds strong. Sellers are watching for signs of exhaustion in the correction to strike.
---
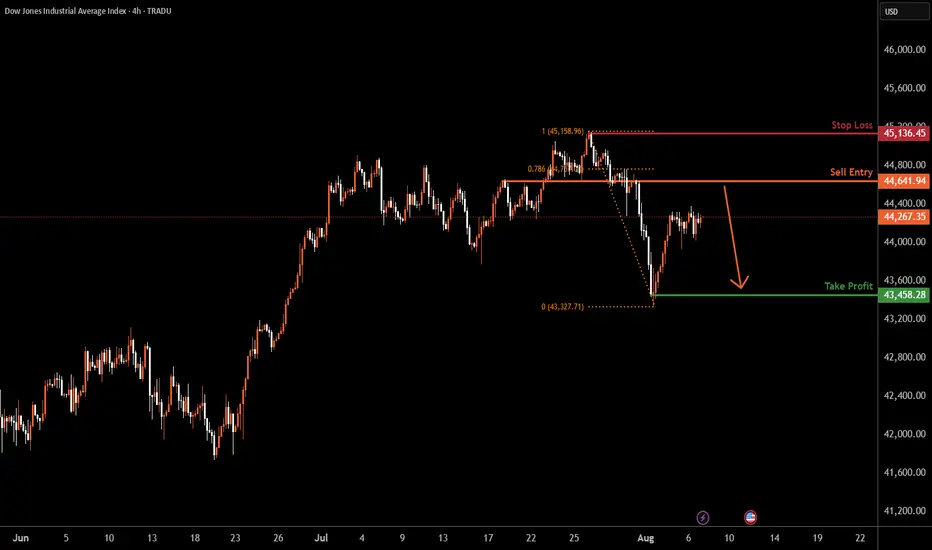
US30 H4 | Bearish reversalDow Jones (US30) is rising towards the sell entry which is an overlap resistance and could reverse to the downside.
Sell entry is at 44,641.94, which is an overlap resistance that is slightly below the 78.6% Fibonacci retracement.
Stop loss is at 45,136.45, which is a swing high resistance.
Take profit is at 43,458.28, which has been identified as a swing low support.
High Risk Investment Warning
Trading Forex/CFDs on margin carries a high level of risk and may not be suitable for all investors. Leverage can work against you.
Stratos Markets Limited (tradu.com ):
CFDs are complex instruments and come with a high risk of losing money rapidly due to leverage. 65% of retail investor accounts lose money when trading CFDs with this provider. You should consider whether you understand how CFDs work and whether you can afford to take the high risk of losing your money.
Stratos Europe Ltd (tradu.com ):
CFDs are complex instruments and come with a high risk of losing money rapidly due to leverage. 66% of retail investor accounts lose money when trading CFDs with this provider. You should consider whether you understand how CFDs work and whether you can afford to take the high risk of losing your money.
Stratos Global LLC (tradu.com ):
Losses can exceed deposits.
Please be advised that the information presented on TradingView is provided to Tradu (‘Company’, ‘we’) by a third-party provider (‘TFA Global Pte Ltd’). Please be reminded that you are solely responsible for the trading decisions on your account. There is a very high degree of risk involved in trading. Any information and/or content is intended entirely for research, educational and informational purposes only and does not constitute investment or consultation advice or investment strategy. The information is not tailored to the investment needs of any specific person and therefore does not involve a consideration of any of the investment objectives, financial situation or needs of any viewer that may receive it. Kindly also note that past performance is not a reliable indicator of future results. Actual results may differ materially from those anticipated in forward-looking or past performance statements. We assume no liability as to the accuracy or completeness of any of the information and/or content provided herein and the Company cannot be held responsible for any omission, mistake nor for any loss or damage including without limitation to any loss of profit which may arise from reliance on any information supplied by TFA Global Pte Ltd.
The speaker(s) is neither an employee, agent nor representative of Tradu and is therefore acting independently. The opinions given are their own, constitute general market commentary, and do not constitute the opinion or advice of Tradu or any form of personal or investment advice. Tradu neither endorses nor guarantees offerings of third-party speakers, nor is Tradu responsible for the content, veracity or opinions of third-party speakers, presenters or participants.
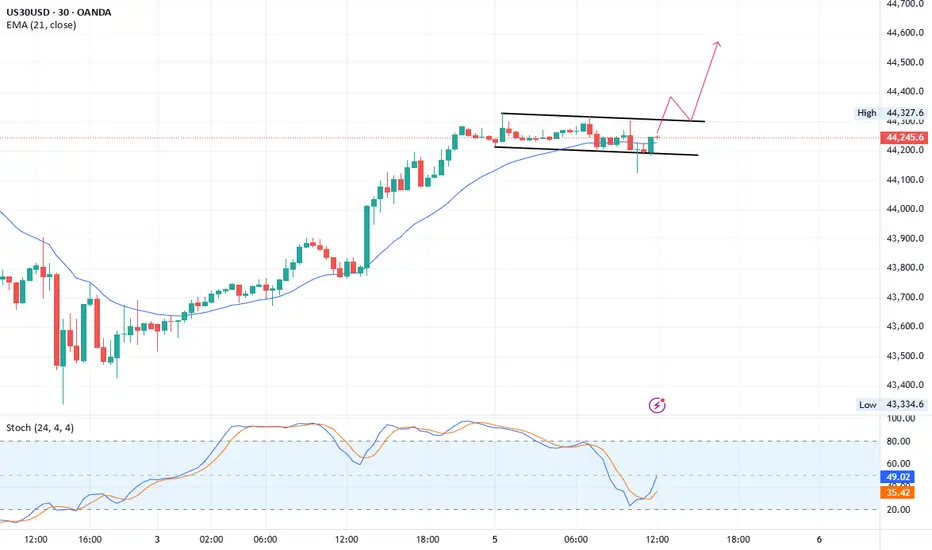
US30: Bulls Are Winning! Long!
My dear friends,
Today we will analyse US30 together☺️
The market is at an inflection zone and price has now reached an area around 44,197.65 where previous reversals or breakouts have occurred.And a price reaction that we are seeing on multiple timeframes here could signal the next move up so we can enter on confirmation, and target the next key level of 44,301.05.Stop-loss is recommended beyond the inflection zone.
❤️Sending you lots of Love and Hugs❤️


DowJones at pivotal zoneKey Support and Resistance Levels
Resistance Level 1: 44515
Resistance Level 2: 44710
Resistance Level 3: 45100
Support Level 1: 43945
Support Level 2: 43756
Support Level 3: 43482
This communication is for informational purposes only and should not be viewed as any form of recommendation as to a particular course of action or as investment advice. It is not intended as an offer or solicitation for the purchase or sale of any financial instrument or as an official confirmation of any transaction. Opinions, estimates and assumptions expressed herein are made as of the date of this communication and are subject to change without notice. This communication has been prepared based upon information, including market prices, data and other information, believed to be reliable; however, Trade Nation does not warrant its completeness or accuracy. All market prices and market data contained in or attached to this communication are indicative and subject to change without notice.

US30 Holding Above Key Pivot – More Upside Ahead?US30 – Overview
The price has stabilized within the bullish zone after holding above the key pivot level at 44170, indicating continued upside momentum. As long as the price remains above this level, we expect a move toward the next resistance at 44360, with potential for an extension toward 44610. A confirmed breakout above 44610 on the 1H timeframe could open the path toward the next resistance at 44730.
However, a 1H close below 44170 may trigger a short-term correction toward 43960.
A break below 43960 would shift the bias to bearish, with further downside likely toward 43785 and potentially 43630.
Resistance: 44360, 44610, 44730
Support: 43960, 43785, 43630