Dow breaks Dow breaks if it sustains then market can give a handsome return following the fed rate cut
US30 trade ideas

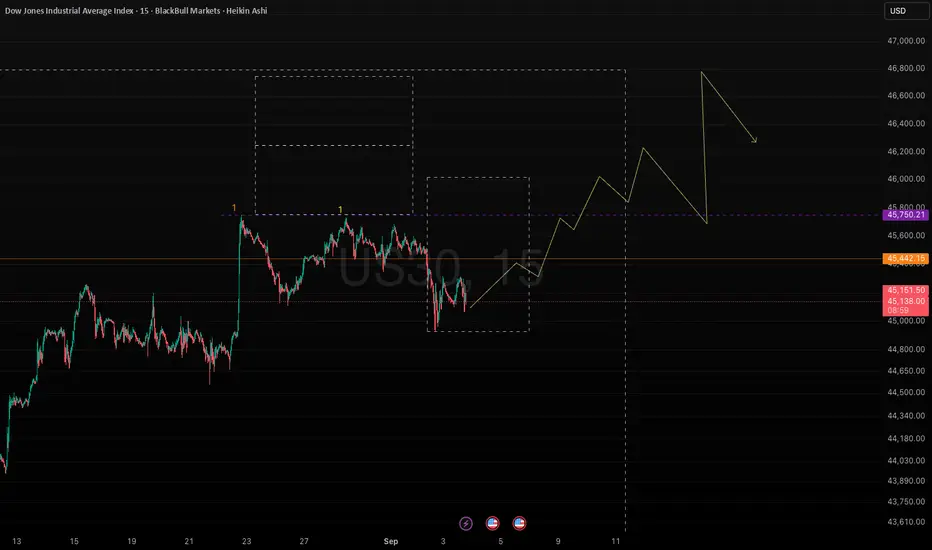
All time high. Down next couple of months. Then up again.Easy roadmap. We hit a nice all time high today. Great moment for a short position now untill early 2026.

DOW JONES INDEX completed its 5 WAVES UP, what's next?Powell's speech this morning boosted the market up and creating a new high.
BUT.. It also completed the last impluse wave, wave 5.
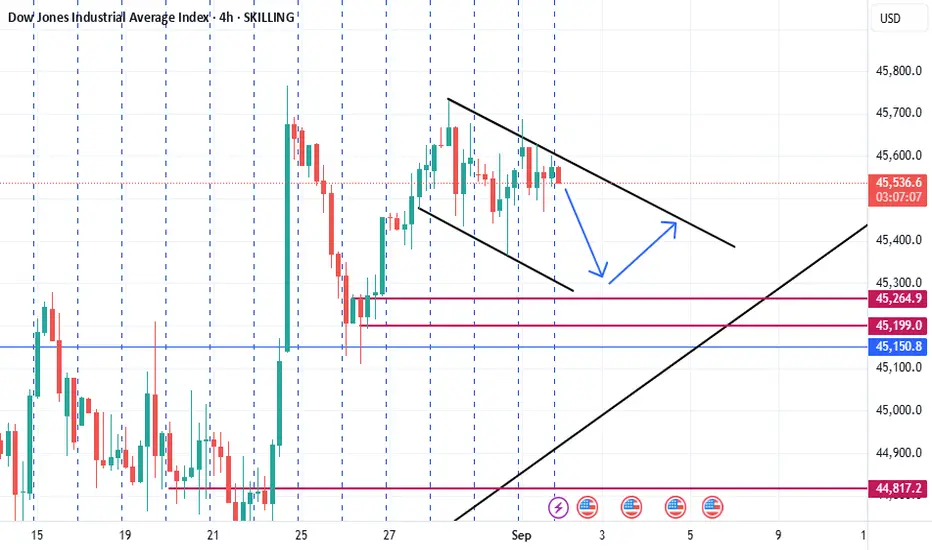
Next movement, whether to be a correction or a massive trend reversal shoud be DOWN.
So i am SHORTING now.. A-B-C correction is going to happen anytime soon!
My expectation is 1-2 weeks ahead is correction time.
LET'S GO!

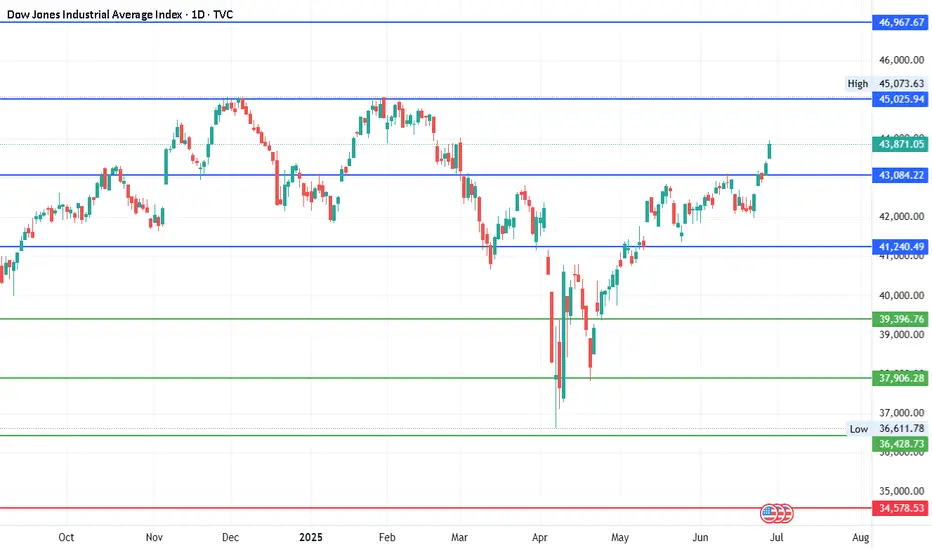
#DJI - 5000 Pts already moved out of 8000 points..Date: 27-06-2025
#DJI - 5000 Pts already moved out of 8000 points as posted on 22nd April. Another 3000 points to cover. we have different pivot for the next level up and it will be shared soon.
Old levels are as follows.
#DJI Upside Targets: 41240.49, 43084.22, 45025.94 and 46967.67
#DJI Downside Targets: 34578.53, 32728.34, 30786.61 and 28844.88
Current price is around 43,870 at the time of this post.
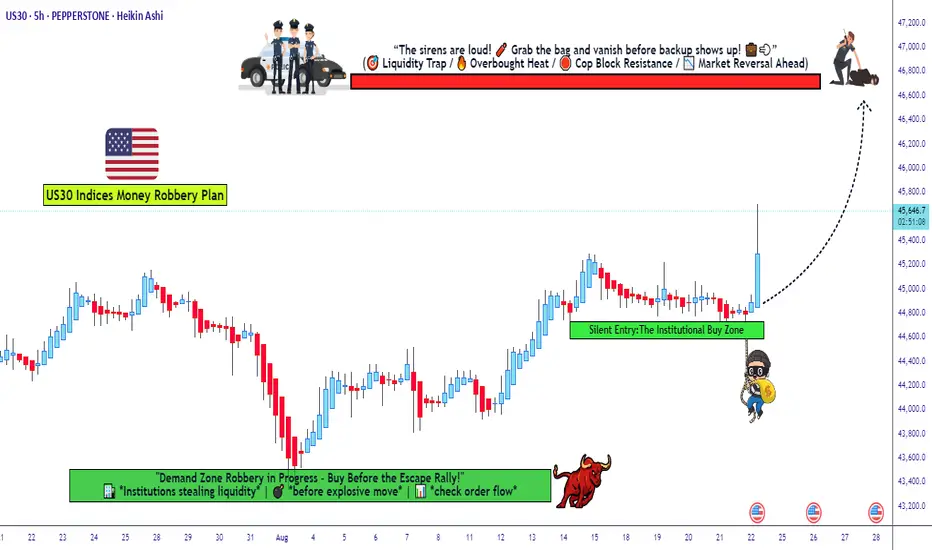
Dow Jones Bulls Preparing Another Robbery — Are You In?🚨💰 US30/DJ30 Index CFD Market Heist Plan 🏦🎭
🕵️ Dear Thief OG’s, Ladies & Gentlemen of the robbery squad… the vault is wide open again! This time we’re sneaking into the Dow Jones (US30) for a Bullish Day/Swing Heist. 🔥
🎯 Robbery Blueprint
Asset: US30/DJ30 Index CFD (Day/Swing Trade)
Plan: Bullish 📈
Entry (Thief Style):
The thief never knocks once… we layer the doors! Multiple buy limit orders 🔐:
Layer 1 → 45,600.0
Layer 2 → 45,400.0
Layer 3 → 45,200.0
(You can expand the layers depending on your risk appetite 🕳️)
Stop Loss (SL) 🛑:
📍 Thief SL @ 44,600.0
(Adjust based on your own risk & startergy – remember, survival is key in every robbery 🏃💨)
Target (TP) 🎯:
🚓 Police barricade spotted @47,000.0! Our sweet escape is planned at 46,800.0 before sirens catch us. 💰
🏆 Thief Strategy
Multiple limit order entries (layering method / scaling in).
Enter at any price level if you’re fast, but layering is the OG Thief move.
Manage your SL & risk like a pro robber – no reckless moves, or you’ll end up behind market bars! 🚔
💡 Why This Heist? 💡
The US30/DJ30 is primed for a bullish run 📈, driven by real-time market signals:
Technical Analysis: Strong support levels holding firm, momentum indicators screaming bullish! 📊
Fundamental Outlook: Check global market data, COT reports, and sentiment analysis for confirmation. 🔗👉
Volatility Watch: Stay sharp for news releases that could spike volatility. 📰⚠️
⚠️ Thief’s Risk Management ⚠️
News Alert: Avoid new trades during major news drops to dodge wild price swings. 🚫
Position Management: Use trailing stops to lock in those sweet profits. 🔐
Risk Control: Adjust lot sizes and SL based on your layered entries and risk profile. 📉
🏆 Join the Heist! 🏆
💥 Hit the Boost Button 💥 to power up our Thief Trader crew! 🚀 Let’s make bank with ease using the Thief Trading Style! 💸😎 Stay tuned for the next heist plan, and let’s keep robbing the markets! 🤑🐱👤
Dow Jones in Accumulation: Breakout Will Set the TrendMarket Overview:
US30 is stuck in a sideways range 45,000–45,600 after a strong rally. This consolidation looks like an accumulation phase before the next impulse. Price remains above the EMA (144), confirming buyer strength.
Technical Signals:
Accumulation range: 45,000–45,600.
EMA (144) acts as support.
No breakout – no strong move.
Key Levels:
Support: 45,000 – 44,800 – 43,300
Resistance: 45,600 – 46,000
Scenario:
Main: breakout above 45,600 opens the path to 46,000–46,400.
Alternative: close below 45,000 could trigger a decline towards 44,800–44,300.
Conclusion:
Dow Jones is building energy. Once the range is broken, a strong trend will follow.


US30: Move Down Expected! Short!
My dear friends,
Today we will analyse US30 together☺️
The in-trend continuation seems likely as the current long-term trend appears to be strong, and price is holding below a key level of 45,228.37 So a bearish continuation seems plausible, targeting the next low. We should enter on confirmation, and place a stop-loss beyond the recent swing level.
❤️Sending you lots of Love and Hugs❤️

US30 | Divergence at all time highCorrection is long due and now it has also printed bearish divergence after hitting its all time high.In order to stay bullish it needs to have a minor correction or has to enter a consolidation phase.In other case a big correction is not out of sight.
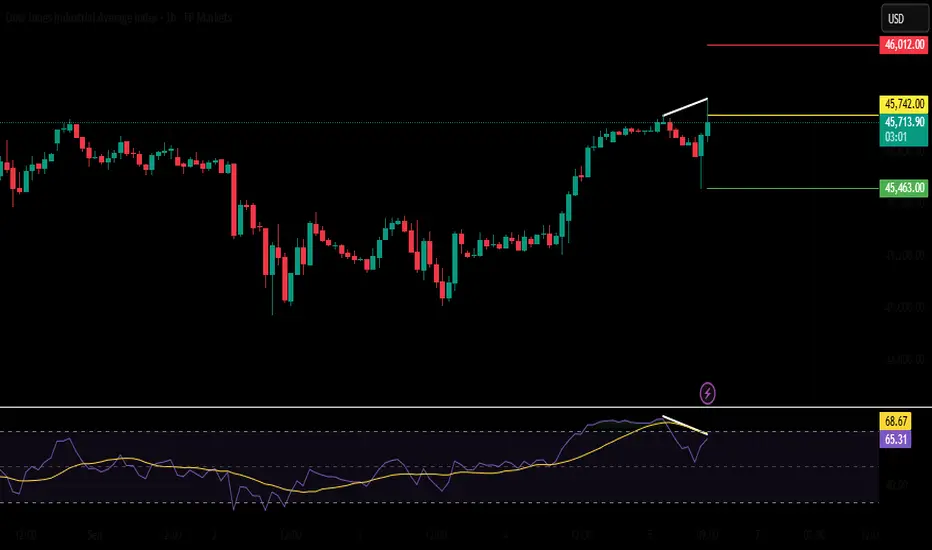
Us30 Trade Set Up Sep 5 2025FX:US30
www.tradingview.com
price is making HH/HL and is testing ATH soon so i will be waiting for a pullback into 15m FVG then a continuation higher

US30 | RetracementAfter a bullish rally a minor retracement was imminent.So it mat take a minor correction before once again going into uptrend.


Will US30 Reach A New Record High After Today's NFP?Fundamental approach:
- The Dow Jones Industrial Average (US30) rose this week amid cooling US labor signals that reinforced expectations for a Sep Fed rate cut, while upbeat ISM services activity tempered growth concerns.
- ADP private payrolls slowed and jobless claims ticked higher, bolstering bets for easier policy ahead of today's NFP release. This kept risk appetite supported through Thu record-setting close in broader indices.
- The ISM Services PMI accelerated to 52.0 in Aug, with stronger business activity and new orders, but continued employment contraction, a mix consistent with disinflationary growth that equity markets favored. Salesforce (CRM) underperformed on a cautious revenue outlook even as rate-cut hopes lifted cyclicals within the Dow complex.
- Looking ahead, the index could extend gains if payrolls and earnings metrics cool without signaling a hard landing, as this may cement Fed easing later this month. Today's jobs report and subsequent Fed communications could be key catalysts for rate expectations and index momentum.
Technical approach:
- US30 bounced up from retesting the ascending channel's lower bounce, confluence with the support at 45000, and EMA21.
- If US30 breaches the resistance at around 45700, the index may accelerate to retest the confluencing area of several Fibo Extension levels at around 46680-46900.
- On the contrary, closing below 45000 may prompt a further correction to retest EMA78.
Analysis by: Dat Tong, Senior Financial Markets Strategist at Exness

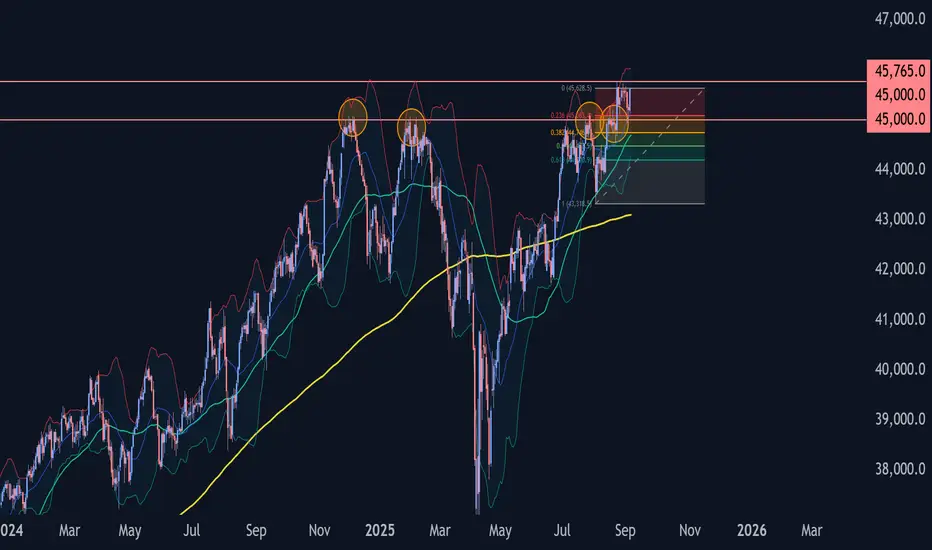
Dow Jones Index Wave Analysis – 4 September 2025- Dow Jones Index reversed from key support level 45000.00
- Likely to rise to resistance level 45765.00
Dow Jones Index recently reversed from the support area between the key support level 45000.00 (former strong resistance, which has been reversing the price from the end of 2024), 20-day moving average and the 38.2% Fibonacci correction of the upward impulse from August.
The upward reversal from this support area stopped the previous short-term correction ii.
Given the strong daily uptrend, Dow Jones Index can be expected to rise to the next resistance level 45765.00 (which reversed the Index in August).
Us30 Trade Set Up Sep 4 2025FX:US30
www.tradingview.com
Price has made a HH but hasnt broken out of it so i want to see price test SSL and either close above with a 1m-2m IFVG to go higher or close under to go down towards PDL

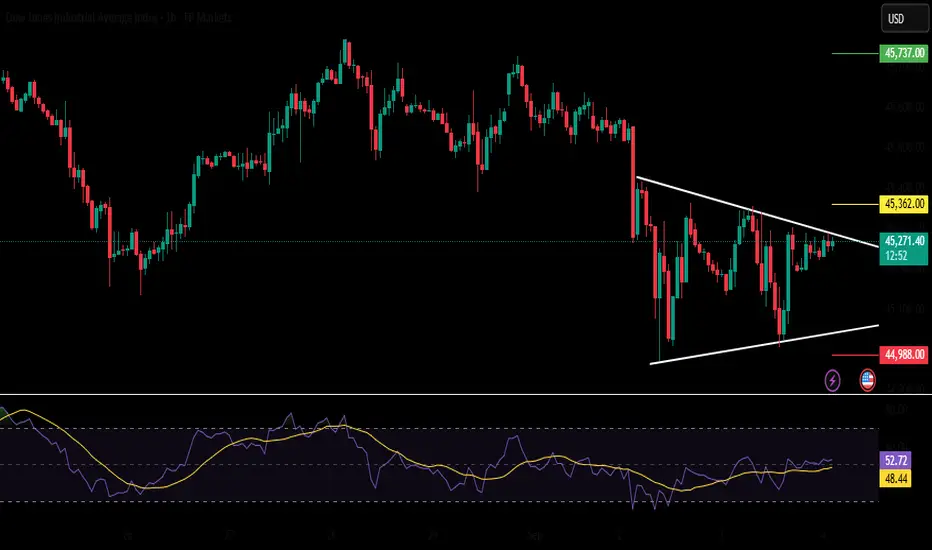
US30 | Rising Wedge PatternUS30 has formed and rising wedge pattern.The breakout of the wedge will once again put the indice into an uptrend.
US30predict for 3 month ago blob blob blbo....
all of my idea is on the chart what the hell i must say?
Us30 longU30 forms a spring on the 4hr.
The general market is bullish on the daily, so underlying conditions are on our side, I can't stress enough the value of that,
So far, setup looks A+

SHORT ON DJ / US30 READINGInner trendline Break and Retest earlier today
Change the Bias on Long for US30 to a Short in our group
We start Selling at the Breakout On H2 timeframe
Entry Price .... 45,600.0
DJ / US30... 45,600.0
S/L ...45,750.00
T/P ...45,989.0
Also looking at a final touch to 44,500.0 LEVEL.
Make sure to Subscribe for more and early trade signal.

Dow Jones Index Analysis (US30 / Dow Jones)At today’s market open, the Dow Jones index started to decline and is currently testing a key support level at 45,100.
🔺 Bullish Scenario:
If the price rebounds and holds above 45,300, this may drive the index higher toward 45,500.
🔻 Bearish Scenario:
If the price breaks below 45,100 and holds, the index may head to test the 44,700 support area.
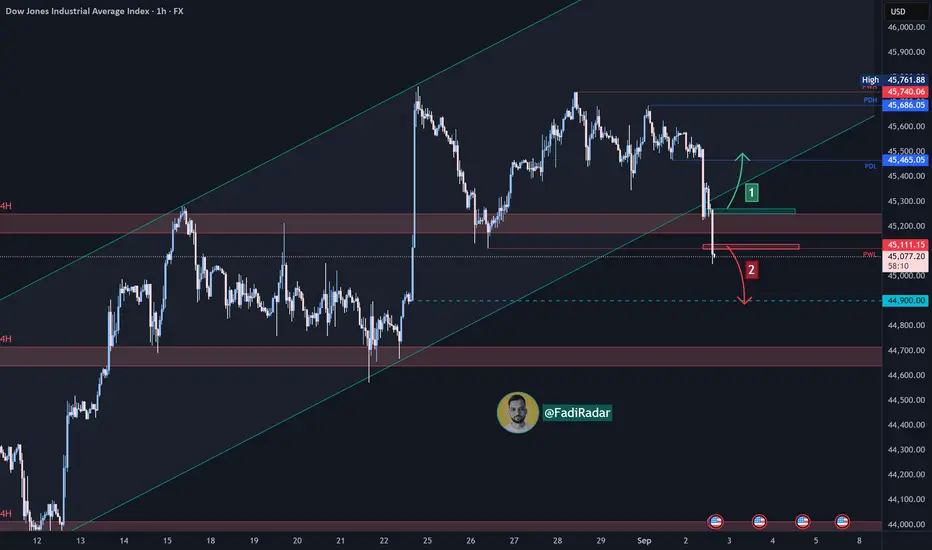
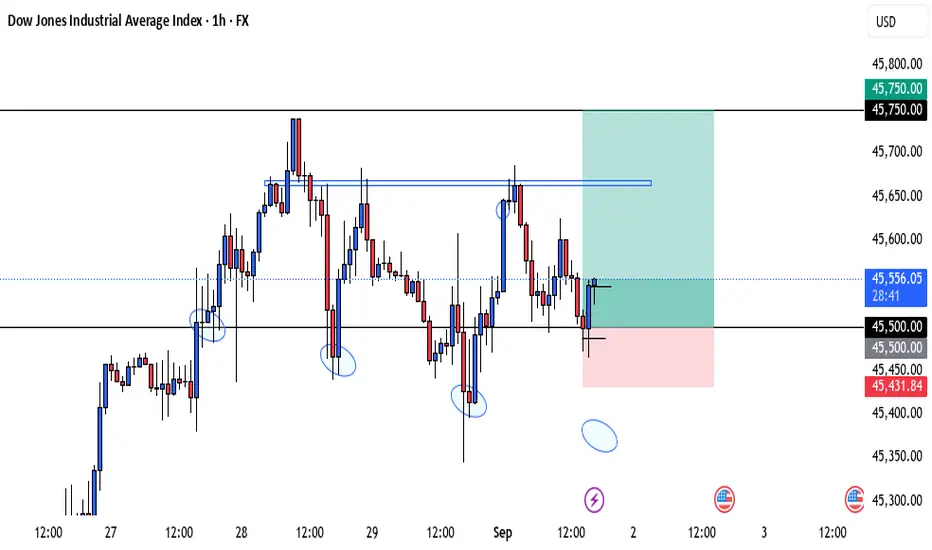
US 30 TRADE IDEA 1 SEPTEMBER 2025This week, the US30 is trading within a short-term descending channel, signaling a corrective phase rather than a full reversal, while the higher timeframe structure remains bullish. Price is approaching a key demand zone between 45,200 and 45,150, where liquidity is likely to be swept before a potential continuation higher. From a Smart Money Concepts perspective, this area aligns with a bullish order block that could drive price back toward the 45,600–45,800 region once buyers step in. However, a clean break below 45,000 would invalidate this setup and open room for further downside toward 44,850–44,700. Fundamentally, the focus will be on US labor market data, including jobless claims and the upcoming NFP release, as signs of a cooling labor market may reinforce expectations of Fed rate cuts later in the year, supporting equities. Conversely, stronger-than-expected data or hawkish Fed commentary could pressure the Dow in the short term. Overall, the primary bias is bullish after a liquidity grab around 45,200–45,150, with upside targets near 45,800, but traders should remain cautious of a bearish continuation if 45,000 fails to hold.
Us30 active buy Us30 active buy aiming for +120 pips Target to create the wick on the last daily candle without a wick
aslong as we remain above MAs we are bullish

US30 (Dow Jones) Approaches Key Resistance - Can It Break ThrougThe US30 (Dow Jones Industrial Average) is putting on a show today, pushing higher towards a critical resistance zone.
Key Levels to Watch:
* Resistance: The major ceiling is clearly at ~45,750. The price has tested this level multiple times today and is currently consolidating just below it. A decisive break and close above this could signal a strong bullish continuation.
* Support: Immediate support sits near 45,430-45,490. A break below this zone could see a pullback towards the 45,300 level.
The price action is looking strong, but the real test is happening now at this significant resistance. Volume on a breakout will be key for confirmation.
What's your take?
* Bullish breakout above 45,800?
* Or a rejection for a pullback?
Tags: #US30 #DOWJONES #Trading #Investing #Stocks #Finance #TechnicalAnalysis #PriceAction #Resistance #Support #TradingView