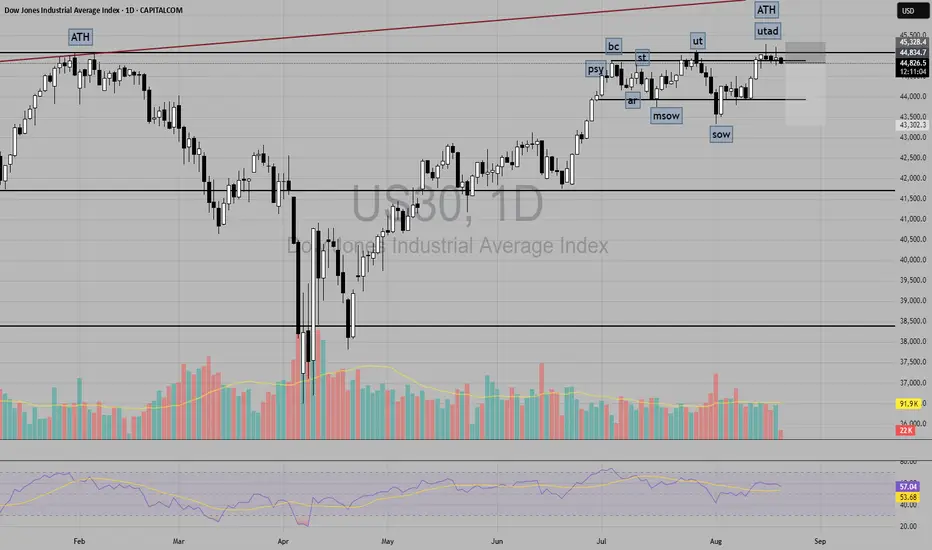
DJIthis is DJI daily chart ...
a self explainatory chart ...
from the lows,
looks like we have completed 5 waves in DJI...
if this top is not broken , we are surely going down ...
I am expecting DJI have completed 5 of 5 of V...
and its time for it to start downward journey
Just a view!
Vedang ! :)
Disclaimer: Chart is for study purpose only!!
Dow Jones Industrial Average Index
45,348.70USDR
−280.50−0.61%
As of today at 14:32 GMT
USD
No trades
US30 trade ideas


US30 Outlook: Waiting for Range Break Confirmation Dow JonesI’m looking at the US30 📊 right now, and price is currently range-bound 🔄, reflecting ongoing pressure in the market. While I’m watching closely for an opportunity, it’s important to recognize when to step aside and wait for the market to set up 🕰️. If we see a break below the current range low followed by a retest ⬇️, that could present a selling opportunity. Conversely, if price breaks higher and retests the previous high ⬆️, that could offer a buy setup. For now, I’m remaining on the sidelines 🪑 until one of these scenarios unfolds with the momentum I’m looking for 🚀. (Not financial advice.)

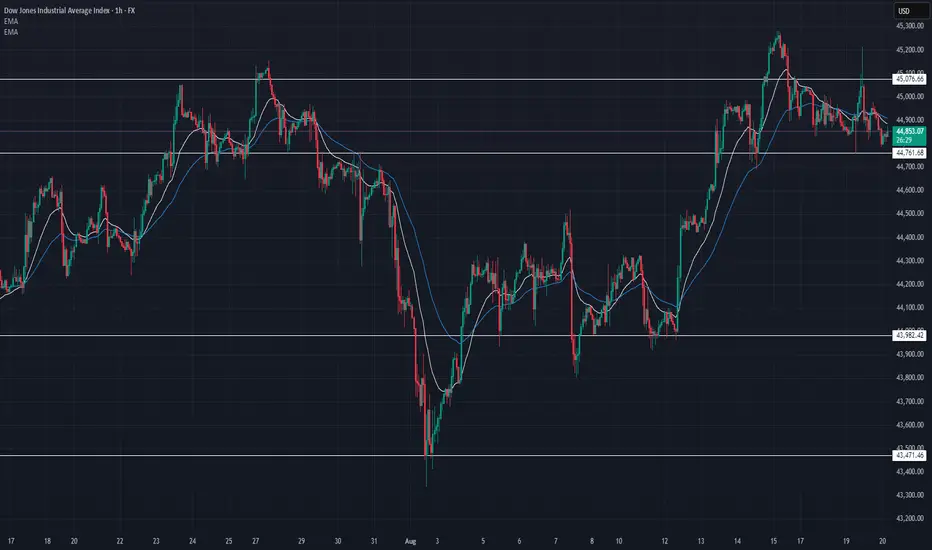
US30 Technical Breakdown – 08/20/2025📍 US30 Technical Breakdown – 08/20/2025
US30 currently trades around 44,860, consolidating after yesterday’s pullback from the 45,200 peak. Price is sitting right above the 44,761 support zone, with EMAs flattening → showing indecision.
Bulls need to reclaim 45,076–45,200 to regain momentum. A failure here risks another drop back toward 43,982.
📊 Current Market Behavior:
🔹 Sideways chop after sharp rally & rejection
🔹 Support holding at 44,761
🔹 EMAs tight → potential breakout building
📌 Key Levels:
Resistance: 45,076 → 45,200 → 45,400
Support: 44,761 → 43,982 → 43,471
🧠 Bias:
Neutral with bearish lean unless 45,200 is reclaimed.
💡 Trade Ideas:
🔹 Long scalp above 44,761 → TP: 45,076
🔹 Breakout long above 45,200 → TP: 45,400
🔹 Breakdown short below 44,700 → TP: 43,982

Sell Dow Jones (US30) – Elliott Wave & Chart Pattern OutlookThe chart applies Elliott Wave and pattern analysis on the Dow Jones (US30). Price has completed a large rounded bottom formation (Wave 4 to Wave 3 structure) and is currently consolidating within a contracting triangle pattern.
The market is testing resistance near 45,000.
A corrective wave count (A–B–C–D–E) suggests a possible short-term pullback toward ~43,000 before resuming the next impulsive rally.
If the triangle completes, the next major bullish wave could push US30 significantly higher, with a target above 48,000.
Key Levels:
Support: 43,000 → 41,865
Resistance: 45,000 → Breakout toward 48,000
This indicates a short-term corrective dip is possible, but the long-term bias remains bullish.

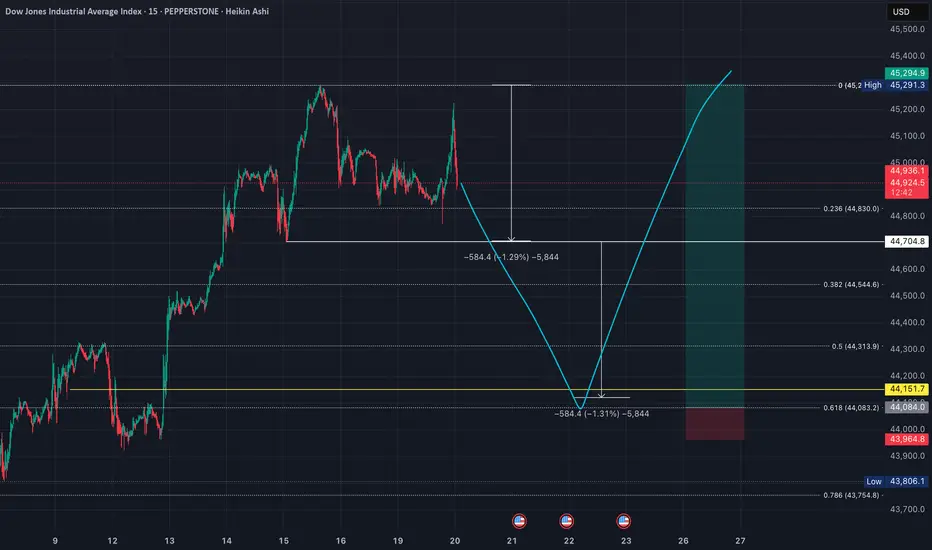
US30 (DOW): Equal Leg Projection Meets Fibonacci - Long SetupSharing my outlook on the Dow, which aligns with my NASDAQ analysis but with a specific mathematical approach. 📊
**🎯 The Setup:**
I'm targeting a long position based on an equal leg projection. Taking the range from the recent low to the all-time high, I expect a decline equal to that same distance. This projection perfectly coincides with the 0.618 Fibonacci level - a powerful confluence. 🎯
**📍 Entry Strategy:**
The beauty of this setup is the mathematical precision: the equal leg down from the high lands exactly at the 0.618 Fib level. This confluence gives me high confidence in this support zone for a potential long entry. ✅
**⚠️ Risk Management:**
Stop loss would be placed below the projected low, targeting new all-time highs. Clean entry, clear invalidation level. 🛑
**🧠 Why This Works:**
Equal leg projections are powerful tools in market analysis. When combined with key Fibonacci levels, they create high-probability reversal zones. The market often respects these mathematical relationships. 📐
**🔄 Bigger Picture Alignment:**
This setup aligns with my broader market view - expecting one final push higher before any significant correction. The Dow's equal leg projection gives us a precise entry point for this bullish thesis. 📈
**💡 Key Insight:**
When geometric projections align with Fibonacci levels, it creates what I call "mathematical harmony" in the markets. These setups often provide the best risk-adjusted opportunities. 🎵
📈 **This trade setup offers a risk-to-reward ratio of 10:1.** Without including fees, the breakeven win rate for this trade would be approximately 9.09%. Knowing these figures in advance helps me avoid emotional trading. 🧠
💡 **Pro Tip**: If you often find yourself trading based on emotions, I recommend doing this type of pre-planning and quantifying your setups before execution — it can be a simple yet highly effective improvement. ✅
---
**Trading is simple.** You don't need multiple indicators or dozens of lines on your chart. A clean and simple chart often works best — it keeps your decisions consistent and reduces uncertainty. Sure, it might not look flashy, and my analysis may seem a bit "plain" compared to others… but that's how I like it. If you find this analysis useful, feel free to follow me for more updates.
---
*Disclaimer: This post is for general informational and educational purposes only. It does not constitute financial advice, investment recommendation, or a service targeting specific investors, and should not be considered illegal or restricted information in any jurisdiction.*
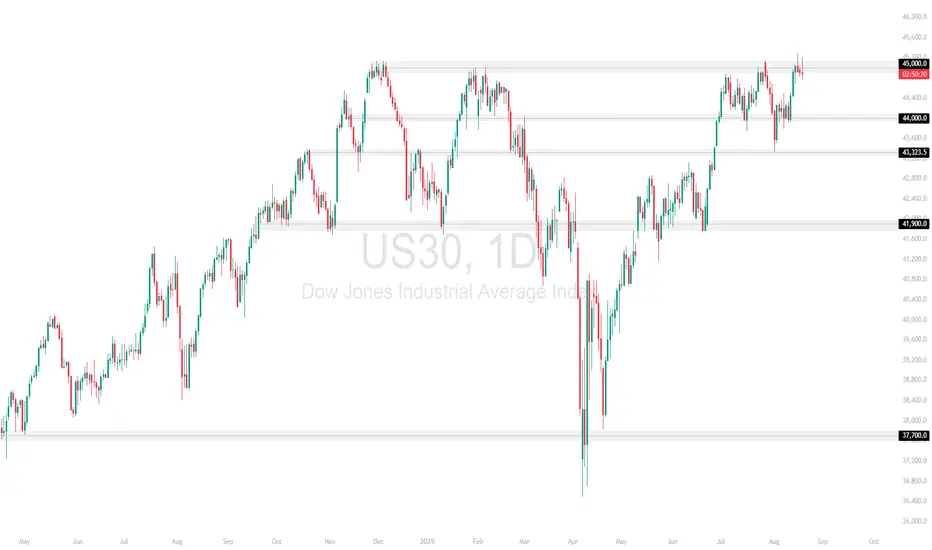
US30 Holding 45,000 – Key Zone in PlayUS30 is consolidating just under the 45,000.0 level after a strong rally, showing indecision at this resistance.
Support at: 44,000.0 🔽 | 43,323.5 🔽 | 41,900.0 🔽 | 37,700.0 🔽
Resistance at: 45,000.0 🔼
🔎 Bias:
🔼 Bullish: A breakout and close above 45,000.0 could extend upside momentum.
🔽 Bearish: Failure to hold may trigger a pullback toward 44,000.0 and 43,323.5.
📛 Disclaimer: This is not financial advice. Trade at your own risk.

Aug ~12th UpEssentially, the resistance below has turned into a huge wall of support.
Going to need a few days to consolidate, but the ingredients are there and ready to cook. Maybe not exactly on the 12th. Expect rally to last until early Sept. once it starts.
Not giving any start or SL because I suck at technical analysis. You do you.


US30: Next Move Is Down! Short!
My dear friends,
Today we will analyse US30 together☺️
The recent price action suggests a shift in mid-term momentum. A break below the current local range around 45,140.8 will confirm the new direction downwards with the target being the next key level of 45,050.1 and a reconvened placement of a stop-loss beyond the range.
❤️Sending you lots of Love and Hugs❤️

Dow Jones Analysis (US30 / Dow Jones):The index is currently trading in a long-term bullish trend, while moving within a corrective bearish channel on the hourly timeframe.
1️⃣ Bullish Scenario (More Likely):
If bullish momentum continues and the index holds above 45,000, it may target 45,200. Sustained buying pressure could push the price toward a new high.
2️⃣ Bearish Scenario:
If the price breaks below 44,870 and stabilizes under it, the index could retest 44,700, with further downside potential toward 44,500 if selling pressure persists.

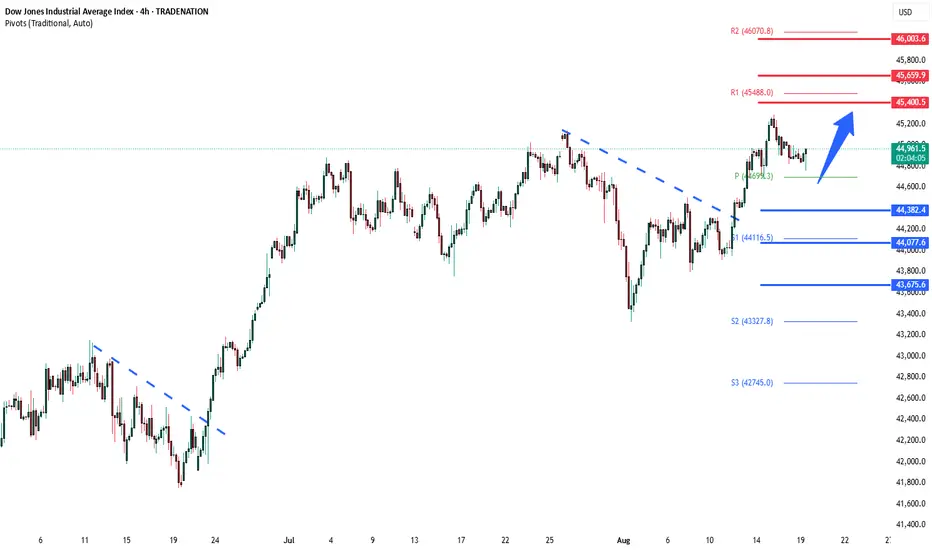
DowJones range trading below ATHKey Support and Resistance Levels
Resistance Level 1: 45400
Resistance Level 2: 45660
Resistance Level 3: 46000
Support Level 1: 44380
Support Level 2: 44080
Support Level 3: 43675
This communication is for informational purposes only and should not be viewed as any form of recommendation as to a particular course of action or as investment advice. It is not intended as an offer or solicitation for the purchase or sale of any financial instrument or as an official confirmation of any transaction. Opinions, estimates and assumptions expressed herein are made as of the date of this communication and are subject to change without notice. This communication has been prepared based upon information, including market prices, data and other information, believed to be reliable; however, Trade Nation does not warrant its completeness or accuracy. All market prices and market data contained in or attached to this communication are indicative and subject to change without notice.


US30 Outlook: Earnings in Focus, 44,950 Key PivotUS30 Overview
The price action today is likely to be influenced by Home Depot NYSE:HD earnings.
If the 4H candle closes above 44,950, this would strengthen the bullish outlook, opening the way toward 45,100 and 45,285.
However, as long as the index trades below 44,950, the bias remains bearish, targeting 44,720 and 44,610.
In summary, while below 44,950, the market remains in a bearish trend.
Support Levels: 44,720, 44,610, 44,470
Resistance Levels: 45,100, 45,285

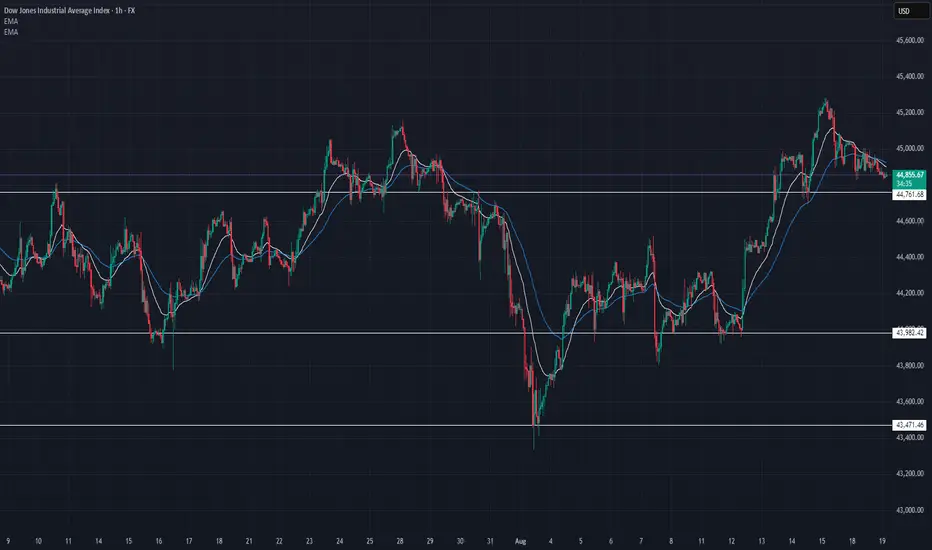
US30 Technical Breakdown – 08/19/2025📍 US30 Technical Breakdown – 08/19/2025
US30 is currently trading around 44,859, pulling back after failing to sustain above 45,200. Price rejected from the upper range and is now sitting just above the 44,761 support zone.
The EMAs are flattening, showing momentum stalling. If 44,761 gives way, bears could press back toward 43,982. Bulls must reclaim 45,000–45,200 to regain control.
📊 Current Market Behavior:
📉 Rejected from 45,200 high
📊 Testing support at 44,761
📉 EMAs flattening → neutral momentum
⚠️ Range-bound between 45,200 & 44,761
📌 Key Levels:
🔹 Resistance Zones:
45,000–45,200 → Immediate barrier
45,400–45,600 → Next upside zone
🔹 Support Zones:
44,761 → Key intraday support
43,982 → Demand base
43,471 → Major swing low
🧠 Bias:
📉 Short-term Neutral / Bearish tilt
Dow Jones Wave Analysis – 18 August 2025
- Dow Jones reversed from strong resistance level 45000.00
- Likely to fall to support level 44500.00
Dow Jones index recently reversed down from the resistance zone located between the strong resistance level 45000.00 (which has been reversing the price from the end of 2024) and the upper daily Bollinger Band.
The downward reversal from this resistance zone created the daily Japanese candlesticks reversal pattern Shooting Star.
Given the strength of the resistance level 45000.00 and the overbought daily Stochastic, Dow Jones index can be expected to fall to the next support level 44500.00.

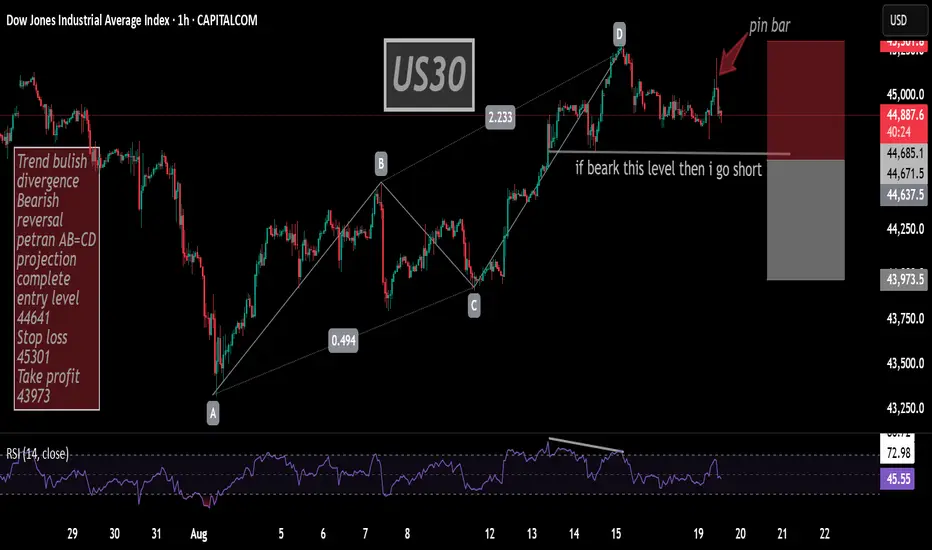
US30 UPDATE - Preparing to SHORTDear Friends in Trading,
How I see it,
Zoomed in on 1HR
Price is at a very strong resistance area at this time.
Multiple rejections especially on bigger timeframes increases the potential to
to fall towards the PIVOT/POC area as per my 4HR analysis.
Keynote:
Only a clear and decisive breach above 45018, can potentially rally towards 45140
I sincerely hope my point of view offers a valued insight
Thank you for taking the time study my analysis.
