#INDY LongCup and handle patter in the making, Volume rising align with the price, low volume correction. I'll wait in the neckline
INDY trade ideas


INDY - POTENTIAL UPSIDEas long as INDY can breakout the resistance area which is between 2070 - 2170 as well as breakout the EMA 100, I assume INDY will continue to go to the next resistance area range 2450 - 2580. The potential upside for this trading will is about 13% - 19%. put the stop loss at 8%

INDY: Inverted Head & ShouldersDuring its super cycle, IDX:INDY forming an Inverted Head & Shoulders pattern with expected target price around 8900 on Q4'25.
Currently it forms low (L) - higher low (HL) - higher low (HL), the upcoming HL supposed to be around level 1375 to 1535, somewhere in Q3'23.
Do you agree to put IDX:INDY into a long-term investment basket?
Think positive!
-AJ-


IDX: INDY FOR NEXT WEEK 18-22 FEB 2022Medium support at 2150
weak resistance at 2340
I Prefer yellow trading plan
Disclaimer:
This information is for educational purposes and is not an investment recommendation or representative of professional expertise. This analysis used herein is for illustration purposes only. This personal opinion should not be considered specific investment advice. I am not responsible for any trades, and individuals are solely responsible for any live trades placed in their own personal accounts.


INDY TRADING STRATEGY INSIGHT next 3 weeksTrading strategy for INDY. If you already buy INDY in 1890-1950, there are potential rebound short term testing resistance area (red area) <2070-2135> with hidden bullish divergence. But, in medium, correction will happen because there are bearish divergence in weekly tf and shooting star candle in monthly. Demand area ideal for buy area in green area, around 1695-1715 and 1520-1555. *Disclaimer on

IDX: INDY FOR NEXT WEEKWEAK RESISTANCE AT 2340
MEDIUM SUPPOT AT 1970
I PREFER GREEN TRADING PLAN
Disclaimer:
This information is for educational purposes and is not an investment recommendation or representative of professional expertise. This analysis used herein is for illustration purposes only. This personal opinion should not be considered specific investment advice. I am not responsible for any trades, and individuals are solely responsible for any live trades placed in their own personal accounts.

INDY Falling Wedge Inside a Potential Cup and Handle PatternBreaking out of the falling wedge pattern will make INDY has a target price of 2000 (+43.88%). There is a potential continuous pattern, cup and handle, with 2000 as the neckline. If the cup and handle pattern is confirmed, the target price will be 3600 (+159%). The probability of INDY breaking out of the falling wedge pattern is bigger than the opposite considering there's MACD Bullish Divergence in the Daily time frame.


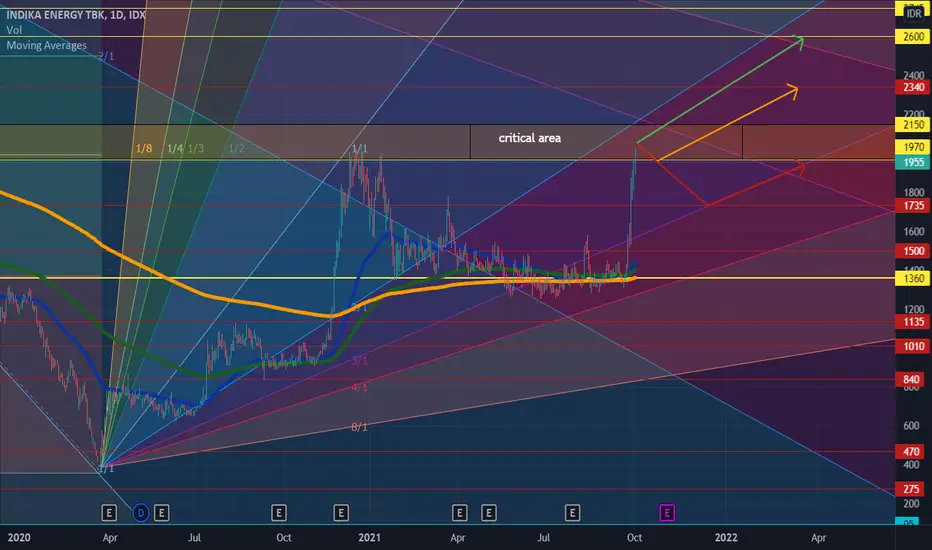
IDX: INDY FOR NEXT WEEKMEDIUM SUPPORT AT 1970
MEDIUM RESISTANCE AT 2600
I PREFER YELLOW TRADING PLAN
Disclaimer:
This information is for educational purposes and is not an investment recommendation or representative of professional expertise. This analysis used herein is for illustration purposes only. This personal opinion should not be considered specific investment advice. I am not responsible for any trades, and individuals are solely responsible for any live trades placed in their own personal accounts.