OMG Look A Butterfly...Low Risk High Reward setup here...I've had to spell it out in so many ways I guess...but anyway thar she blows I think.
KASUSDT.P trade ideas

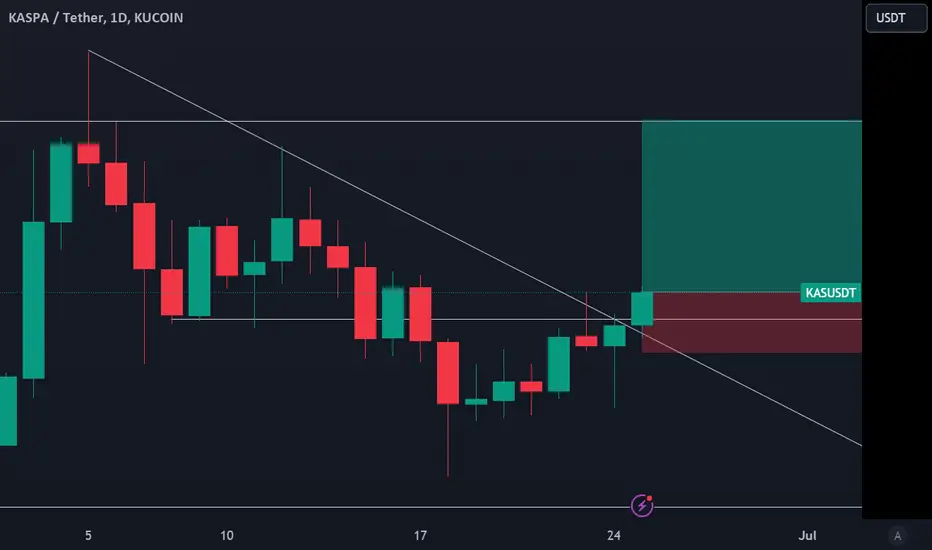
Handelssignal für KASUSDT KaspaHandels-Setup:
Ein Handelssignal wird im KASUSDT angezeigt.
Händler können ihre Kaufgeschäfte JETZT eröffnen.
⬆️Jetzt kaufen oder bei 0,16980 kaufen
⭕️SL @ 0,15728
🔵TP1 @ 0,22000
🔵TP2 @ 0,25500
🔵TP3 @ 0,28800
Worauf basieren diese Signale?
Klassische technische Analyse
Preisaktion Candlesticks Fibonacci
RSI, gleitender Durchschnitt, Ichimoku, Bollinger-Bänder
Risikowarnung
Der Handel mit Forex, CFDs, Krypto, Futures und Aktien birgt ein Verlustrisiko. Bitte überlegen Sie sorgfältig, ob ein solcher Handel für Sie geeignet ist. Die Wertentwicklung in der Vergangenheit ist kein Indikator für zukünftige Ergebnisse.
Wenn Ihnen unsere Ideen gefallen haben, unterstützen Sie uns bitte mit Ihren Likes 👍 und Kommentaren .

Doing It Bigly...The time has come for the music to stop for kaspa - Expecting this to enter a long corrective phase...damp it.

KAS/USDT Technical Analysis in 2-Day Timeframe.Hello everyone, I’m Cryptorphic.
For the past seven years, I’ve been sharing insightful charts and analysis.
Follow me for:
~ Unbiased analyses on trending altcoins.
~ Identifying altcoins with 10x-50x potential.
~ Futures trade setups.
~ Daily updates on Bitcoin and Ethereum.
~ High time frame (HTF) market bottom and top calls.
~ Short-term market movements.
~ Charts supported by critical fundamentals.
Now, let’s dive into this chart analysis:
KAS in the last 48 hours made a new all-time high of $0.198, breaking out above the current resistance level of $0.183.
In the past, whenever KAS broke out above the resistance, it made some outstanding rallies.
Initial Breakout:
~ Period: Late 2022 to early 2023
~ Breakout Point: $0.007
~ Performance: Following the breakout from the symmetrical triangle, KAS/USDT witnessed an impressive upward move, achieving a staggering gain of 500.73%.
Consolidation and Second Rally:
~ Period: Mid-2023
~ Breakout Point: $0.022
~ Performance: The ascending triangle pattern indicated a bullish continuation, which played out with a 170.62% rise from the breakout point.
Current Structure:
~ Breakout Potential: KAS is currently breaking out of another resistance trendline, suggesting a bullish continuation.
~ Projected Target: Based on the height of the triangle, the projected price target is $0.55, representing a potential gain of 201.92% from the breakout point.
Moving Averages:
The chart shows the 100EMA (in purple) acting as dynamic support, consistently supporting the price during pullbacks.
Buy Zone: Consider entries around the breakout point ($0.18).
Targets: $0.32 to $0.54.
Invalidation Point: KAS breaking down and getting rejected below the current resistance.
DYOR. NFA.
Please hit the like button to support my content and share your thoughts in the comment section. Feel free to request any chart analysis you’d like to see!
Thank you!
#Kaspa

KAS below channel with C&H pattern + ascending triangleKAS is booming in popularity on Twitter/X.
Proof of work token featuring BlockDAG technology.
BLOCKDAG Feature: multiple transactions are added to blockchain in a web-like formation
vs
BLOCKCHAIN: Single transactions added to the chain in a single line.
Cup and Handle Pattern formed and playing out.
Turned into an Ascending Triangle.
Both of these are large bullish formations.
Future Resistances based on Fibonacci Levels: $0.23, $0.30, $0.38
Triangle Invalidation Level: $0.155
Support Levels: $0.14, $0.13, $0.125
Average Volume increasing from last month.

I take an entry to short $KAS today.CRYPTOCAP:KAS can be relaxed at 0.1965 or CRYPTOCAP:KAS bullish may stay out from running long way. bear is coming soon.

long KASKaspa broke through the descending trendline and the resistance level. The bullish movement to $0.1842 is expected to happen.
"KAS Coin Analysis: The Market's Most Bullish Coin"💹 Let's dive into one of my favorite coins, KAS, and see if we can find new entry points for our spot positions and medium-term portfolios.
🌟 Weekly Updates:
Starting from Monday to Wednesday, we'll cover , Monday: Bitcoin and Dominance analysis , Tuesday: Ethereum and ETH/BTC analysis , Wednesday: Gold analysis
These are in addition to our daily analyses.
🎉 Channel Milestone 600 Followers:
Thank you all for helping this channel reach 600 followers! Our next goal is 1,000 followers. Let's keep growing together!
🚀 Reasons for KASPA's Recent Growth:
🎯 Advanced BlockDAG Technology:
Using BlockDAG instead of the traditional blockchain has increased processing speed and network security.
🙌 Fast Transactions and Low Fees:
Users are attracted to this network because of its high speed and low transaction costs.
📚 True Decentralization:
Eliminating central entities and ensuring equal participation of all users has increased trust in the network.
💪 Support for Smart Contracts:
The intention to support smart contracts has attracted developers and decentralized applications (dApps).
🚥 Increased Adoption and Usage:
Growing user base and broader acceptance have contributed to the price increase and popularity of Kaspa.
📊 Weekly Time Frame Analysis:
KAS is one of the most bullish coins in the market, consistently forming higher lows. Currently, it's moving between the box of 0.97620 and 0.174767.
After a recent upward trend and a significant move towards the resistance of 0.174767 with high volume, we saw a rejection and correction with lower volume. If we move up with a green candle and significant volume, the probability of breaking the resistance increases.
🌐 If we consider the new trend starting from 0.014801 and the last resistance as 0.174767, Fibonacci levels show key support levels at 0.098506, 0.068505, and 0.051077, which will be important in the future.
Personally, I bought in after breaking the weekly resistance of 0.097620 and closing above it with the confirmation of RSI entering the overbought zone. If you bought similarly or at lower points, you might consider selling after a candle closes below the 0.097620 support or removing your initial investment and staying in the coin with just your profits.
📅 Daily Time Frame Analysis:
After breaking the 0.051920 resistance and entering the RSI overbought zone, and with Bitcoin breaking 30,000 and stabilizing, altcoins including KAS experienced a pump.
Using Fibonacci retracement, the price corrected to about 38%, suggesting that if we break the 0.185222 resistance, a fresh upward trend might start.
For future resistances beyond 0.185222, we use Fibonacci extension, predicting potential resistances at 0.2515, 0.3113, and 0.4087.
⏰ Four-Hour Time Frame Analysis:
Due to high volatility and the overall bullish trend in higher time frames, corrections in KAS are generally less severe compared to other coins.
📈 Long Position Strategy:
wait for a break and confirmation above 0.150861 or 0.160140, and be sure to position yourself after breaking 0.178292. The 0.1782 level needs to be tested again for precise targeting.
📉 Short Position Strategy:
there are better coins in the market like BINANCE:ATOMUSDT , BINANCE:STXUSDT , BINANCE:SNXUSDT , BINANCE:JASMYUSDT , and BINANCE:NEARUSDT . Given the bullish trend, avoid shorting KAS . Bullish coins tend to pump easily during market recoveries, triggering your stop losses.
🛒 Buy Strategy:
For re-entry, wait for a daily or weekly close above 0.185222. Before investing, thoroughly research the project; there might be opportunities to increase your holdings along the way.
🔍 Also, consider the overall market conditions and Bitcoin's behavior. If Bitcoin moves towards the 71,710 resistance and BTC dominance continues to drop, bullish coins like KAS can provide significant gains.
🔑 Support and Resistance Levels:
Support Levels: 5.565, 4.776, 3.969
Resistance Levels: 6.844, 7.629, 8.360
😊 If you'd like me to analyze a specific coin or currency pair, be sure to comment so that I can allocate the next analysis for you!
⚠️ Also, please remember that I'm just an analyst, and this isn't financial advice . We're here to stay in the market and maximize profits by adhering to risk and capital management principles.

Tell me this ain’t a strong break out happeningLooking at the weekly chart, daily chart, and five minute chart you can clearly see we are in a breakout you didn’t get in right now. I’m not a financial advisor.

KAS: Approaching ResistanceTrade setup : Remain in an Uptrend. It pulled back briefly but made a Higher Low (sign of Uptrend) and broke back above $0.15 key level. Momentum has inflected bullish (MACD Histogram bars are rising). Price is now approaching our near-term target $0.194 for a +25% gain. Now we look for the right entry opportunity in Uptrend. We wait for price to either 1) break above $0.20 to signal continuation of uptrend, or 2) pull back near $0.15 support for another swing trade entry in Uptrend with +25% upside potential back to $0.194.
Pattern : Price is Approaching Resistance , which is a level where it could pause or reverse its recent advance, at least temporarily. Resistance is often a level where price got rejected in the past, or potentially prior Support level that was broken. (concept known as polarity). Once price breaks above resistance, it can advance higher to the next resistance level. Learn to trade key levels in Lesson 7.
Trend : Short-term trend is Strong Up, Medium-term trend is Up and Long-term trend is Strong Up.
Momentum : Price is neither overbought nor oversold currently, based on RSI-14 levels (RSI > 30 and RSI < 70).
Support and Resistance : Nearest Support Zone is $0.15, then $0.13. Nearest Resistance Zone is $0.194, then $0.24.

Trading Signal For KASUSDT Kaspa Trading Setup:
A Trading Signal is seen in the KASUSDT
Traders can open their Buy Trades NOW
⬆️Buy now or Buy on 0.16980
⭕️SL @ 0.15728
🔵TP1 @ 0.22000
🔵TP2 @ 0.25500
🔵TP3 @ 0.28800
What are these signals based on?
Classical Technical Analysis
Price Action Candlesticks Fibonacci
RSI, Moving Average , Ichimoku , Bollinger Bands
Risk Warning
Trading Forex, CFDs, Crypto, Futures, and Stocks involve a risk of loss. Please consider carefully if such trading is appropriate for you. Past performance is not indicative of future results.
If you liked our ideas, please support us with your likes 👍 and comments .

Kaspa inverted head and shoulder bullish pattern $KASLooking at the KAS chart on the 4 hr tf, there's a potential for an inverse head and shoulders pattern, which usually signals a bullish reversal
Disclaimer: The information provided here is for educational purposes only and does not constitute a buy or sell recommendation. I am not a financial advisor and I reserve the right to be incorrect. Do not make trading decisions based on information from the internet. Always consult your financial advisor or conduct your own research before making any investment decisions.

#KAS/USDT breaks the Diagonal Trendline in 1-Hour TF!#KAS/USDT breaks the Diagonal Trendline in 1-Hour TF!
CRYPTOCAP:KAS looking bullish here. Wait for PWH $0.01619 to successfully retest to long it. #KASUSDT's local resistance level is PWH $0.19175, and the local support level is PMH $0.1443.

buy again at 0.1680I think Kaspa need a little turn down and then go up again...
0.18 is strong rersistance
.... think 0.1680 ( or lower ) would be nice enter

KASPAdyor - nfa, see previous posts and good luck!
-continuation pattern, loose targets into .25/.30 with pattern target into .55 cents

KASPA showing strength and continuing to consolidate to upsideKASPA showing strength and continuing to consolidate to upside

Chart Idea - KASUSDT Swing Long SetupKASUSDT Long Setup
Confirmations:
- Weekly Stoch RSI cross over
- Bounced beautifully from 0.618 fib level of 0.097 range
- Successful retest of weekly bull flag breakout support which coincides with 0.382 fib level
Entry: 0.11
TP: 0.378
SL: 0.099
It’s a swing long which can play out in weeks if not months.

KASKAS on the HTF seems it is doing a similar pattern with the November consolidation below ATH before explosive expansion.
More of a HTF guide than actual trading based on it but helps with spot bags conviction

KAS 8HRI see a very nice short here on KAS. Looking too clear vector zone on the way down into the golden pocket fib, you should lose yearly vwap on the way to the downside

Kaspa ThesisThis is not a price prediction its just my thesis for Kaspa, 2 Escenarios: one Bullish and favorable for Investors and another Bearish and not Favorable (Fishy Behavior).
Im Bullish so Far.

Kaspa | KAS (100X in Bear Market!)If Kas can jump 10000% in bear market, what will happen in bull market then ?
Well first of all Respect the pump and the beautiful chart pattern because while all world class banks dump like Ponzi scheme there are many solid projects in crypto that shines and shows crypto is the future of the finance and technology.
Kas still didn't list on big exchanges which means there are more liquidity and attention on the way but right now you should know the best case scenario for a token with 320 million dollars market cap is a billion which means almost 300% from here so don't do YOLO and jump in with hype
if you are in good gain then take some profit and have some fun and if you wonder whats the next Kaspa and crypto gem then you can count on our experts

Bullish Pennant Structure seen in KASPA - $KAS The hourly chart shows a bullish pennant structure which is a bullish pattern.
Disclaimer: The information provided here is for educational purposes only and does not constitute a buy or sell recommendation. I am not a financial advisor and I reserve the right to be incorrect. Do not make trading decisions based on information from the internet. Always consult your financial advisor or conduct your own research before making any investment decisions.

KASPA forming distribution , local top???As much as I love kaspa it looks like we are in for a retracement down 50% or more from current levels. id be interested in picking this up under 7 cents.
