#KDA/USDT#KDA
The price is moving in a descending channel on the 4-hour frame and is sticking to it well
We have a bounce from the lower limit of the descending channel and we are now touching this support at a price of 0.520
We have a downtrend on the RSI indicator that is about to be broken, which supports the rise
We have a trend to stabilize above the moving average 100
Entry price 0.530
First target 0.543
Second target 0.560
Third target 0.581
KDAUSDT trade ideas

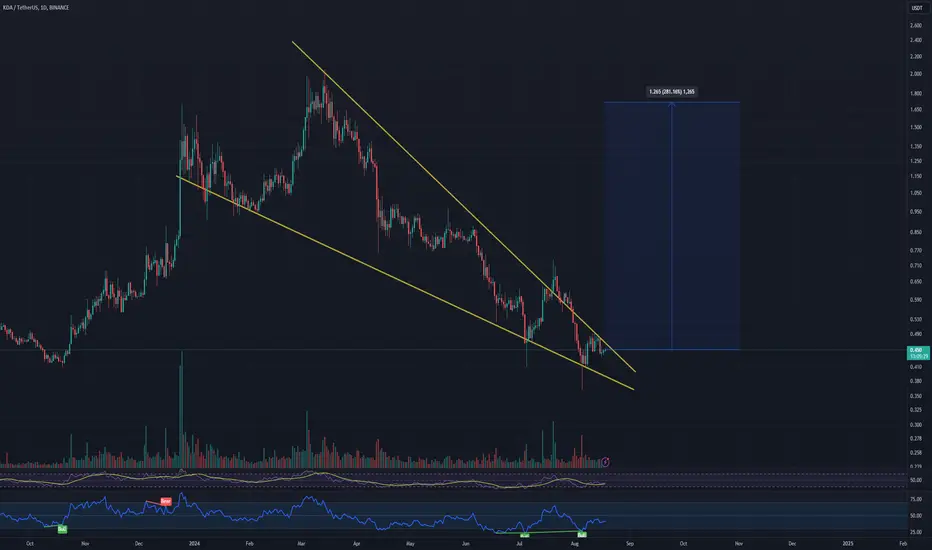
#KDA Poised for a 281% Upswing! GETTEX:KDA #KDAUSDT is setting up for a potential breakout from a long-term falling wedge pattern. Currently trading at $0.450, the technicals suggest a remarkable 281.16% gain, with a target price of $1.265. This could be the perfect moment to enter before the rocket takes off!
⚠️ All trading ideas are published with a time delay. If you want to follow the trading in real-time, please follow the link:
#KDA/USDT#KDA
We have a descending channel pattern on the 4-hour frame, the price is moving inside it and adhering to its borders well
We have a support area in green at a price of 0.500 after the price touched it and rebounded from it
We have a trend to stabilize above the moving average 100
We have a downtrend on the RSI indicator that supports the price upwards
Entry price 0.580
First target 0.684
Second target 0.76
Third target 0.833

KDAUSDT Bullish TrendKDAUSDT is showing bullish trend, we can enter into the trade after the break of last HH, keeping stop loss at last LL.

#KDA (SPOT) entry range( 0.500- 0.620) T.(1.197) SL(0.465)BINANCE:KDAUSDT
entry range( 0.500- 0.620)
Target1 (0.823) - Target2 (1.197)
SL .1D close below (0.465)
*** collect the coin slowly in the entry range ***
*** No FOMO - No Rush , it is a long journey ***
**** #Manta ,#OMNI, #DYM, #AI, #IO, #XAI , #ACE #NFP #RAD #WLD #ORDI #BLUR #SUI #Voxel #AEVO #VITE #APE #RDNT #FLUX #NMR #VANRY #TRB #HBAR #DGB #XEC #ERN #ALT #IO #ACA #HIVE #ASTR #ARDR #PIXEL #LTO #AERGO #SCRT #ATA #HOOK #FLOW #KSM #HFT #MINA #DATA #SC #JOE #RDNT #IQ #CFX #BICO #CTSI #KMD #FXS #DEGO #FORTH # AST #PORTAL #CYBER #CLV #RIF
ENJ #ZIL #KDA ****

KDA/USDT: Is a Massive Move About to Unfold?Yello, Paradisers! Are you ready for a potential big move with #KDAUSDT? Let’s dive in and break down what could be brewing beneath the surface .
💎#KDAUSDT is showing strong signs of a potential bullish continuation from the crucial support zone at $0.610. We've seen the price holding solid momentum above the EMA, signaling that the bulls are in control. This increases the probability of an upward push .
💎For some time now, #KDA has been respecting a descending resistance. But recently, after breaking above it, we’ve noticed growing momentum right at this key support. If the price continues to hold strong at this level, there’s a high chance we’ll see a bullish rally that could push the price towards $0.995.
💎However, be cautious: if this momentum doesn’t hold at the key support, we might witness a dip to the lower support around $0.489 before seeing a potential rebound. Monitor #KDA’s movements closely! A daily close below the $0.610 demand zone could invalidate the bullish scenario and lead to further declines. Always be prepared for different outcomes.
Remember, Paradisers, disciplined and patient trading is the key to long-term success. Stay focused, avoid emotional decisions, and always wait for the best, high-probability setups. It's all about consistency, not quick profits. Stay sharp out there!
MyCryptoParadise
iFeel the success🌴

KDAKDA
I’ve been holding GETTEX:KDA for a significant period, and I believe the following targets are achievable:
Price Targets
1st TP
$5-$6 (not looking too far away)
2nd TP
$11-$13
Final Euphoria Target
$50 (long-term)
#NFA #DYOR
Your likes and follows are greatly appreciated!

KDAUSDT Ready For a Bullish Breakout from the Falling WedgeYello, Paradisers! Are you ready for what could be a pivotal moment for #Kadena? Let's look at the latest analysis of #KDA:
💎We've been tracking #KDAUSDT closely, and the signs are pointing to an exciting continuation from the Bullish OB at $0.436. The falling wedge pattern we've observed is finally about to see a breakout above the descending resistance.
💎Now, all eyes are on the next target—the key resistance at $0.62. If #KDA holds its ground here, we could be in for a significant bullish rally, mirroring previous upward trends.
💎But here's the catch: if momentum fails to sustain at this level, we might see #KDAUSDT drop, with a possible bullish rebound from the lower demand area around $0.36-$0.39. This is a critical juncture, Paradisers. Staying vigilant is essential.
💎Keep a close watch on price movements of GETTEX:KDA , especially around the demand area. A daily closure below this zone could invalidate the bullish outlook and open the door to further declines.
Stay updated, focused, patient, and disciplined, Paradisers.
MyCryptoParadise
iFeel the success🌴

KDAUSDT(Kadena) Updated till 18-09-24KDAUSDT(Kadena) Daily timeframe range. finally it moved out of its trouble zone. very close to 0.731 if volume stays it got chance to push through. local retrace point is at 0.561 which needs to hold if it fails than back to trouble zone.

Kadena (KDA) — Reversal in the Making?Kadena (KDA) has captured significant attention today. The token is one of the top gainers, with a peak of over 30% in intraday trading (it is currently still up +18%).
The surge has been driven primarily by Binance’s announcement of launching USD-margined perpetual contracts for KDA.
The big question is: Does this pump signal a long-term reversal, or is it a temporary reaction to news?
Let’s break it down in this post.
1️⃣ Key Technical Points
• Bottom Formation at $0.40: After months of downward pressure, KDA found a solid bottom at ~$ $0.40. The token has shown resilience and bounced consistently off this level.
• Resistance at $0.66: The first significant test for KDA is closing above the $0.66 resistance level. The token must break and hold this area to confirm a more sustained uptrend.
• Next Targets: $0.86 and $0.95: If KDA breaks $0.66, the next logical resistance levels to watch are $0.86 and $0.95. These levels will serve as significant barriers, but clearing them would allow KDA to move even higher, possibly toward the $1 mark.
2️⃣ What’s Next
• Confirming the Reversal: While today’s pump is encouraging, waiting for confirmation is essential. For the token to establish a solid bullish trajectory, a close above $0.66 is necessary. Without this, the pullback risk remains, especially considering the pump may be news-driven.
• Potential Pullback: If the $0.66 resistance holds and KDA is rejected, we could see a retracement to the $0.50-$0.52 area, which has previously served as minor support. If market sentiment shifts, a deeper pullback to $0.41 could also be possible.
3️⃣ Volume Insights
The volume has steadily increased, reflecting growing interest and confidence in the token’s price action. While this supports the bullish case, we need more volume to confirm the breakout above $0.66.
Kadena’s recent surge is promising but hinges on its ability to close above the $0.66 resistance level. If KDA can break above this level, a move to $0.86 and $0.95 becomes likely.


Kadena | TA Made Simple: Ying YangHello successful trader, let's make technical analysis simple.
The market cycles mainly between two phases, a bearish phase and a bullish wave.
These are the two polarities: up and down.
➖ A bullish wave is followed by a bearish wave.
➖ A bearish wave is followed by a bullish wave.
It is that simple.
➢ It doesn't matter the time of the year, nor what politics or global finance says; the market cycles between up an down... After a bearish wave follows a bullish wave.
Here we have this very same dynamic shown on the chart.
➖ Kadena went bullish late 2023.
➖ Kadena went bearish early 2024.
The last event was a bearish wave. We are now set to experience a bullish wave, in accordance with standard market dynamics. This can be a big one.
Namaste.

Kda Getting Ready For Solid Recovery After Long Correction Finally Kda Preparing For Solid Recovery falling wedge breakout and retest has already confirmed
as resistance has got cleared sold recovery can start any time expecting 2x bullish wave

KDA USDT Current Price 0.468
after rest this level 0.487 Buy Green Line
STOP LOSS 0.455
TP 1 0.517
TP 2 0.556

KDAUSDT 1WKDA ~ 1W
#KDA Are you interested in buying it again. if yes, then this is the lowest price currently. expecting a profit of at least 20%

KDA → It is worth taking the risk!hello guys!
I think this coin and this position are valuable!
It made a Qm pattern! on the other hand, the reward to risk is more than 20x!
___________________________
✓✓✓ always do your research.
❒❒❒ If you have any questions, you can write them in the comments below, and I will answer them.
❤︎ ❤︎ ❤︎And please don't forget to support this idea with your likes and comment

#KDA Buy Trade **Technical Analysis Chart Description:**
Welcome to my Technical Analysis charts on TradingView! Before we dive into the analysis, it's essential to understand some important warnings:
1. **Subjectivity Alert:** Technical analysis involves interpreting market data and chart patterns, which can be subjective. Different analysts may interpret the same data differently, leading to varied conclusions.
2. **Historical Performance Doesn't Guarantee Future Results:** Past price movements do not guarantee future price movements. While historical data can provide insights, it's crucial to consider other factors that could influence price action.
3. **Risk of False Signals:** Technical indicators and chart patterns can produce false signals, leading to potential losses if relied upon blindly. Always cross-verify signals with other indicators or fundamental analysis.
4. **Market Volatility:** Crypto markets are highly volatile and can experience rapid price fluctuations. Be prepared for sudden and unexpected price movements, which may invalidate previously identified patterns.
5. **Risk Management:** Proper risk management is essential. Never invest more than you can afford to lose, and consider using stop-loss orders to mitigate potential losses.
6. **Emotional Bias:** Avoid emotional decision-making based on short-term price movements. Stick to your trading plan and strategy, and don't let fear or greed influence your decisions.
**Disclaimer for Crypto Trading:**
Trading cryptocurrencies carries inherent risks, and it's important to understand the following:
Cryptocurrency markets are highly speculative and can be subject to extreme volatility. Prices can fluctuate significantly within short periods, leading to substantial gains or losses.
Investing in cryptocurrencies involves the risk of total loss of capital. Unlike traditional assets, cryptocurrencies are not backed by any tangible assets or central authority, making them inherently risky.
Regulatory uncertainty and market manipulation are additional risks associated with cryptocurrency trading. Regulatory changes or negative news can have a significant impact on prices.
This analysis is for informational purposes only and should not be construed as financial advice. It's crucial to conduct thorough research and consult with a qualified financial advisor before making any investment decisions in the cryptocurrency markets.
By using this analysis, you acknowledge and accept the risks associated with cryptocurrency trading and agree to trade at your own discretion. The author of this analysis shall not be held responsible for any losses incurred as a result of using the information provided.

Kadena - $KDAKadena is a proof-of-work blockchain that blends Bitcoin's PoW consensus with DAG principles, providing a scalable version of Bitcoin. Key features include:
Scalability: Kadena offers industrial scalability, supporting global financial systems and scalable as needed.
Energy Efficiency: More transactions can be processed with the same energy input, making it more energy-efficient than Bitcoin.
Multi-Chain Approach: Decentralized infrastructure designed for mass adoption.
Crypto Gas Stations: Businesses can cover gas fees for their customers, easing blockchain adoption.
Network Expansion: Scaled from 10 to 20 blockchains with potential for further scaling.
Layer-Two Solution: The private Kuro blockchain supports up to 8,000 transactions per second across 500 nodes.
Kadena aims to provide secure, high-throughput blockchain solutions for enterprises and entrepreneurs.
The light blue highlighted area represents a strong demand zone.
This level has been a significant support in the past, preventing further upward movement.
Trendline Break: The downtrend line appears broken recently, indicating a potential shift from bearish to bullish sentiment.
The price begins forming a rounded bottom pattern, suggesting a potential reversal.
A key resistance level is identified at 0.877, the projected target for the upward movement.
Ensure proper position sizing to avoid overexposure to market volatility.

Kadena (KDA)Kadena once became so popular that its price exploded upward. After that, not surprisingly, KDA entered a corrective wave, a long one. It seems the corrective wave have rested at 0.786 Fibonacci level and is consolidating in a rectangle shaped pattern. Also, an A-B-C pattern might unfold; if true and C=A, this means price sharp upward move could be experienced again. Let's see what happens.

KDA short on 1H TF to buy back lowerIt appears that KDA is currently testing the RESISTANCE area, which was expected. If you're interested SCALPING , you might consider SELL some KDA at this resistance area..
don't forget to boost and support our channel to receive more update
happy trading !!

KDAUSDT looking very bearishStructure is very bearish. However price could bounce anytime.
The most logic price level would be the all time low.

Time for KDA?This is my idea on KDA and how it will go in the future. KDA showed great potential in the last few months, but there are not many green candles when it's going down from the last higher high which is around 2. That worries me a little bit. Anyway, this is the opportunity to consider spot and futures trade, maybe either. I am waiting to break the support zone below, reach liquidity, and pull back in. Maybe CHOCH or BOS in 1H - 4H TF. 0.95-1 zone is very crucial, closing the candle above 1.05 in 1W TF will be a huge confirmation.
Will do an update on Entry and Take Profit zones.

KDAUSDT - Inverted H&S FormingKDAUSDT is reaching the bottom of its right arm of a larger inverted H&S structure
Arrows show the head and both shoulders
Bars pattern shows my speculative price recovery on this daily chart
Structural pattern buy
