Beginner Friendly Price Action Analysis For GoldIn this video, I demonstrate the process of analyzing a chart from a top down perspective so that the beginner trader can understand the process.
GOLD Futures
150,590KRW / GRMD
+3,270+2.22%
At close at Jun 12, 05:42 GMT
KRW / GRM
No trades
KGD1! trade ideas


GOLD- WATCHING IT CLOSELY.🔍 Chart Analysis
🏗️ Structure & Patterns
A perfect Cup & Handle formation is visible.
Price has broken out above the neckline (~₹98,000) but is currently in a pullback phase, forming the handle.
A falling wedge breakout is also seen prior to the breakout — a bullish continuation pattern.
📐 Fibonacci Retracement
0.382 level at ₹96,132
0.5 level at ₹95,132
These retracement levels align well with the handle zone and offer potential re-entry/buy levels.
🛡️ Key Support Levels
Level Description
₹98,000 Former resistance, now short-term support
₹96,132 38.2% Fib retracement
₹95,132 50% Fib retracement (also demand zone)
₹94,200 Major support
🔵 Note: Breakdown below ₹95,132 is bearish confirmation.
📊 RSI Analysis
RSI = 54.59, cooling off from overbought levels.
RSI has crossed below the RSI-based moving average (63.43), indicating temporary loss of momentum.
📈 Projected Path
The handle curve suggests a possible rebound after this pullback, targeting previous high ~₹99,358, and possibly ₹101,317 (height of cup projected upward).
✅ Summary
Category Observation
Pattern Bullish Cup & Handle with falling wedge breakout
Trend Bullish above ₹95,132; Weak only if closes below
Key Levels Support: ₹98,000 / ₹96,132 / ₹95,132 / ₹94,200
Resistance: ₹99,358 / ₹101,317
RSI Cooling down; not overbought; healthy retracement
Bias Bullish with pullback in progress; re-entry near ₹96k–95.1k zone
🧠 Final Thoughts
Pullbacks are healthy in bullish setups like this — watch for reversal signs near ₹96,132 or ₹95,132.
A daily close above ₹99,358 can trigger Cup & Handle target breakout toward ₹101,300+.
Maintain bullish bias unless ₹94,200 is breached.

MGC Post Market Update - The Battle of the Two CountsHello Fellow Gamblers,
As you know we are tracking 2 EW counts at this time and they are both still in play.
W5's are tricky to deal with but with a little patience we should be able to make our portfolio grow.
- I am currently looking for bearish divergences to support our bearish Scenario but the current price move strength favors our bullish scenario.
- Be aware of a possible Cup and Handle formation
- Levels to watch: 3508.4, 3441.9, 3365.2, 3314.7.
See you next time!

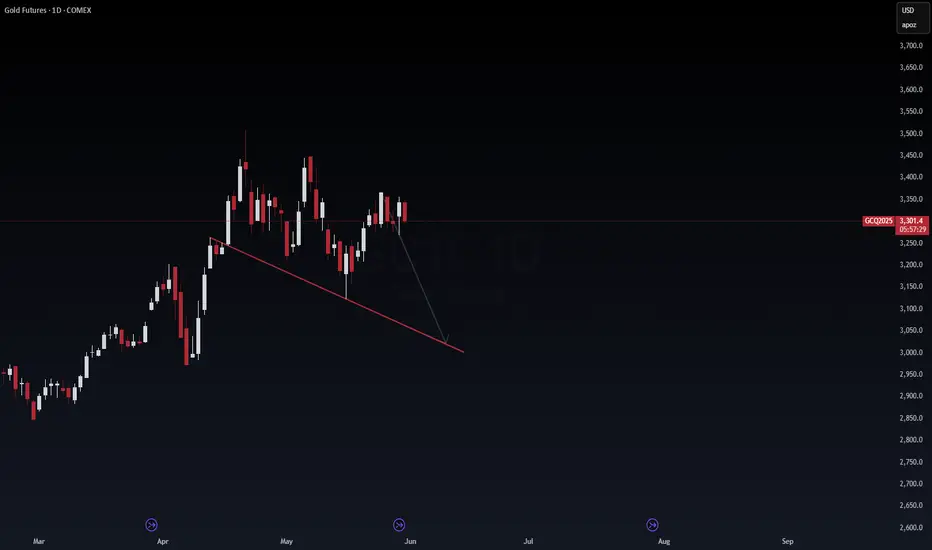
Gold May Continue to Frustrate TradersGold prices have stalled once again and have struggled to make any significant advances since mid-April, remaining stuck in a range between $3,150 and $3,450. This trading range has resulted in sideways price action, with several false starts along the way. However, technical analysis suggests that this range is likely to remain in place.
After breaking above a downtrend in late May — a move that initially appeared convincing, with prices surging to $3,400 — gold has since declined, falling back to $3,300. As of 10 June, it is now retesting that trendline and bouncing at $3,300. This price also represents the 38.2% retracement of the rally from the 15 May intraday low of $3,120 to the 5 June intraday high of $3,400. The combination of the trendline and the Fibonacci retracement level is currently acting as support.
Additionally, the Relative Strength Index (RSI) has broken above a downtrend, indicating a potential shift in momentum. At the time, all of this suggested that gold was likely to retest its previous highs.
However, a new problem has emerged — one that is not particularly favourable for further gains in gold. As of 6 June, the price has fallen below a short-term uptrend and has also stalled at resistance around $3,320.
In addition, the Relative Strength Index has now broken below its own short-term uptrend and is nearing the 50 level — a potentially bearish signal. If these developments are signs that all is not well, then gold could be expected to revisit its early May lows, around $3,100.
As things stand, there are two viable paths for gold, and it is far from easy to determine which one is the correct one. Unfortunately, both scenarios suggest that gold is likely to remain range-bound for some time yet.
Written by Michael J. Kramer, founder of Mott Capital Management.
Disclaimer: CMC Markets is an execution-only service provider. The material (whether or not it states any opinions) is for general information purposes only and does not take into account your personal circumstances or objectives. Nothing in this material is (or should be considered to be) financial, investment or other advice on which reliance should be placed.
No opinion given in the material constitutes a recommendation by CMC Markets or the author that any particular investment, security, transaction, or investment strategy is suitable for any specific person. The material has not been prepared in accordance with legal requirements designed to promote the independence of investment research. Although we are not specifically prevented from dealing before providing this material, we do not seek to take advantage of the material prior to its dissemination.


XAUUSD Bearish Rejection Setup Unfolding – June 11, 2025XAUUSD Bearish Rejection Setup Unfolding – June 11, 2025 🧠🔍
📊 Technical Breakdown:
🔴 Resistance Rejection Zone (Supply Area)
Price recently tested the $3,440 - $3,460 resistance zone, marked with red arrows. This zone previously acted as a strong supply area, leading to aggressive sell-offs.
📉 Bearish Rejection Candle
A rejection occurred near the same supply zone again, hinting at a potential double top or failure to break structure. Sellers seem to defend this area aggressively.
📍 Current Price: $3,338.6
Price is hovering below mid-range resistance at $3,396.5, indicating weakness after a failed breakout.
📉 Bearish Plan in Motion:
🔁 Scenario Highlighted:
Price might retest the $3,396.5 level (purple line) before resuming the downward move (illustrated by the blue and black arrows).
A breakdown below the $3,290.3 support zone will likely trigger further downside.
🎯 Target Levels:
1st Target: $3,290.3 – Key structural support. A close below this level will confirm the bearish momentum.
2nd Target: $3,207.0 – Final support area aligned with previous accumulation zone.
🛑 Invalidation Point:
A sustained breakout above $3,460 would invalidate the bearish bias and suggest continuation to the upside.
✅ Summary:
Bias: Bearish 📉
Strategy: Sell on pullback to $3,396.5 with stops above $3,460.
Targets: 🎯 $3,290.3 ➡️ $3,207.0
Watch for a strong bearish confirmation candle below $3,290.3 to load in shorts.
🔔 Stay alert for volume spikes and lower time-frame breakdowns to fine-tune entries! 💼📊

Shorting GoldWell, iam taking this trade for sure.
Iam shorting Gold again because of the following reasons.
The reason behind this trade is the IFVG that is nested withing the now resistance level (marked in black)
Secondly, there is a broken trendline that i dont think it will be reclaimed anytime soon (marked in yellow).
There are many others small details that should point toward a bearish scenario.
but on a scale from 1 to 10, how confident in my analysis iam, is 7.5.
Boost the idea if you like it : D


Gold exact rejection from supply zone Gold took exact rejection from supply zone . We took sell trade below supply zone sl was above the zone and target is demand zone .
Our strategy is to sell from supply or buy from demand . Today sell got active first and price moved in our direction. Waiting for target demand zone


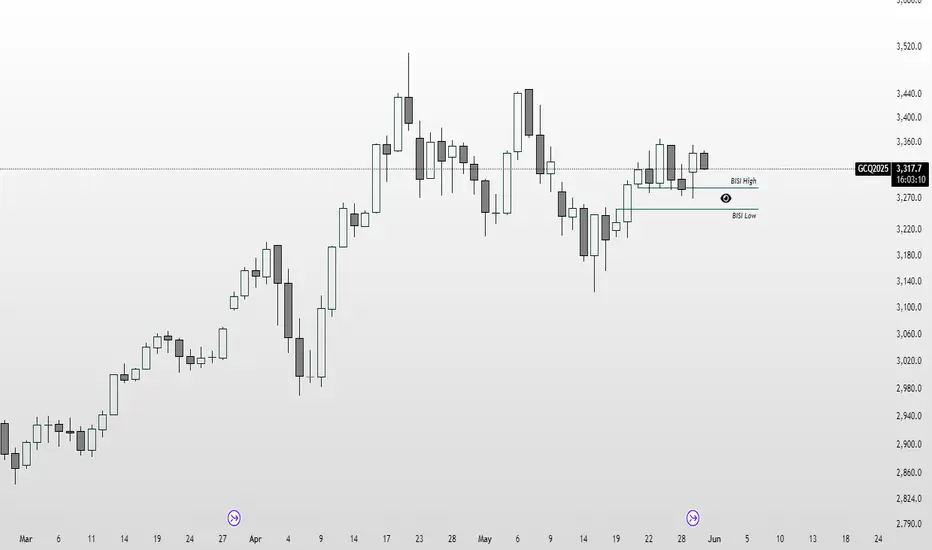
What does the coming month implying?These are the questions that we should ponder:
1. Where are we coming off of? A Premium or Discount price?
2. Where is price likely to go?
3. Does the market have a reason to:
- Seek liquidity above or below the marketplace?
- Seek to mitigate inefficiencies?
4. How did Previous Month Candle close?
5. Do we have bullish or bearish Order Flow?
6. Does the correlated asset (ie. Silver) shows a crack or a change in the state of delivery?
7. Does the Fundamental support the Technical? Note: The shiny metal is an event driven asset.
I'm taking my time to study the Higher Time Frame chart to see the bigger picture, and keeping up-to-date with the current world event.


GOLD GC /GC GC1! XAU/USD: Arbitrage Oppertunity. Gold Futures (GC1!) – Breakdown Ahead? Arbitrage Opportunity Emerging
🔍 Daily Chart Analysis by Wavervanir International LLC
⚠️ Key Technical Observations:
Descending Triangle Breakdown Risk: Gold has rejected resistance near $3,350 multiple times. The lower highs and horizontal support suggest a descending triangle structure.
Projected Breakdown Zone: If $3,280 support fails, we could see a swift move toward $3,100 or even lower, near the $2,950 zone.
Lower Trendline Magnet: Price appears to be gravitating toward a key trendline formed from April’s breakout, which aligns with the $2,950–$3,000 confluence zone.
💱 Arbitrage Opportunity: GC1! vs XAU/USD vs /GC
There is growing dislocation among:
GC1! (Gold Futures – COMEX)
/GC (Front-Month Gold Futures)
XAU/USD (Spot Gold)
Watch for inefficiencies due to:
🔁 Hedging lag across timeframes (spot vs futures)
💰 Rate differential effects (carry cost, interest rates)
🌍 Currency mismatch in spot vs USD-settled futures
If the spot-futures basis widens unjustifiably, a short GC1! / long XAU/USD setup could exploit mean reversion. Advanced traders might also consider calendar spreads (/GC Jun vs Aug) if volatility compresses.
📊 Probabilistic Outlook:
Scenario Probability Commentary
Breakdown Toward $2,950 55% Technical structure favors bears unless macro shifts occur.
Bounce and Range Around $3,300 30% Compression before Fed/JOLTS/NFP may cause chop.
Breakout Above $3,375 15% Requires macro catalyst—like Fed rate cut, geopolitical shock, or weak USD
🧠 Macro Factors to Monitor:
FOMC & FedSpeak (June) – If rate cuts are delayed, gold could lose momentum.
Real Yields (10Y TIPS) – Rising real yields = bearish gold.
Geopolitical Tensions – Any flare-ups (Middle East, Taiwan) may flip sentiment fast.
China/BRICS Demand – Gold import/export data could signal accumulation or slowdown.
💡 We’re monitoring these inefficiencies for tactical plays under the Wavervanir macro-arbitrage lens. Stay updated for real-time trade ideas and DSS-based execution.
#Gold #GC1 #XAUUSD #FuturesTrading #MacroArbitrage #CommodityTrading #Wavervanir #RiskManagement
Gold (GC) Trade Plan – Watching Key Zones for Reaction Currently watching Gold Futures (GC) as price moves within a defined range.
✅ Buy Zone (Green): Waiting for price to reach this demand area and show a bullish reaction confirmed by order flow before entering long.
❌ Sell Zone (Red): If price pushes into this supply area, I’ll consider a short setup only if there’s clear bearish confirmation on order flow (e.g., trapped buyers, absorption, or momentum shift).
⚠️ No reaction = no trade. I’m simply reacting to what the market gives me, not predicting.
Let the flow guide the entries. 🧠📊
