KSMUSDT 1WKSM ~ 1W Analysis
#KSM If you still have a Conviction on this coin,. This is the lowest support for now. Buy from here with a minimum target of 20%+
KSMUSDT trade ideas
KSM Still Waiting Strong SupportKSM successfully filled FVG big 1D candle when retrace to $23
So prefer buy zone aroudn 19-22 i think its best zone if price touch this red line


KSMUSDT 5DKSM ~ 5D Analysis
#KSM If you still have Conviction on this coin. This support isn't too bad to start buying back with a target of at least 20%+

SPOT KSM LONG 21.01.2025Pinning after containment of sales.
🎯Purpose:
37.45
I'll let you know when I record it manually.
‼️Risk per trade: 1% of the allocated funds for spot trading.

SPOT KSM LONG 20.01.2025Pinning after abnormal activity.
🎯Purpose:
43.13
I'll let you know when I record it manually.
‼️Risk per trade: 1% of the allocated funds for spot trading.
Thank you for follow and the reaction🚀.

KSM Buy/Long setup (8H)From the point where we placed the red arrow on the chart, it seems that KSM is forming an expanding triangle or a diametric pattern. Waves A through D have completed, and we are currently in wave E. Wave E is a bearish wave.
We have identified two entries for buy positions.
If the price reaches our entry levels, we will enter buy positions.
The targets are marked on the chart.
A daily candle closing below the invalidation level will invalidate this analysis.
For risk management, please don't forget stop loss and capital management
Comment if you have any questions
Thank You

Kusama's Potential Profits Amidst CorrectionsHi All, 👋
🚀 After the arrival of Smart Money, the Kusama market saw an upward trend 📈, which is now undergoing a correction 🔄. Predicting the exact level at which the price will react or if it will surpass previous levels is challenging. It depends on the buying power and pressure of investors 🏦.
However, there is potential for a movement yielding a 70-100% profit 💰. Despite the promising outlook, it's crucial to avoid gambling 🎲 and always invest or trade with a risk and capital management strategy 📊
🌐 Kusama and Polkadot are both independent blockchains, but they are closely related. Kusama serves as a "precursor" or test network for Polkadot, allowing developers to test projects in a lower-risk environment 🧪. They share a common infrastructure and work on "shared security" and "cross-chain communication" 🔗.
Kusama offers a more experimental environment 🔍, resulting in a higher number of projects compared to Polkadot. Notable projects on Kusama include parachain networks and decentralized applications like Karura, a DeFi platform 💻
Good luck, everyone! 🍀✨
Happy Investing All, ❤️
Armin

KSMUSDT Setup: Will Bulls Step In, or Are We Heading Lower?Yello, Paradisers! Are you keeping an eye on KSM? This setup is shaping up for either a strong bullish recovery or a critical breakdown—and it all hinges on one key support zone. Let's break it down! 👇
💎KSMUSDT is currently showing a proper retracement within a descending channel, which typically signals a high probability of a bullish move ahead. But here’s the catch: the bulls need to reclaim momentum from a critical support zone before we see a confirmed reversal.
💎If KSMUSDT grabs liquidity below and forms a bullish I-CHoCH (Internal Change of Character) on the lower timeframes, it will greatly increase the likelihood of a strong bullish move.
💎However, if we see panic selling or a deeper retracement, we can expect a bounce from the stronger support zone below. At that point, look for bullish patterns like a W formation or an inverse head and shoulders on lower timeframes to confirm the move.
💎If KSMUSDT breaks down and closes a candle below the strong support zone, this will invalidate our bullish idea entirely. In that scenario, it’s best to stay patient and wait for a more favorable price action setup.
Stay disciplined, Paradisers! Remember, it’s all about waiting for the highest probability moves. Jumping in too early can cost you—so keep a close eye on how the price reacts around these key zones.
MyCryptoParadise
iFeel the success🌴

SPOT KSM LONG 11.01.2025Pinning after containment of sales.
🎯Purpose:
37
I'll let you know when I record it manually.
‼️Risk per trade: 1% of the allocated funds for spot trading.
Thank you for follow and the reaction🚀.

Trading opportunity for KSMUSDTBased on technical factors there is a Sell position in :
📊 KSMUSDT
🔴 Sell Now
🪫Stop loss 37.61
🔋Target 31.90
📏 R/R 2,2
💸RISK : 1%
We hope it is profitable for you ❤️
Please support our activity with your likes👍 and comments📝

Ksmusdt buy opportunityKSMUSDT is forming a bullish reversal pattern, with a potential inverse head and shoulders (ISHS) identified. Both shoulders have been formed, indicating a strong reversal signal. The plan is to accumulate within the designated accumulation zone. Focus on the setup targets outlined on the chart for potential upside movement. This pattern suggests a favorable buying opportunity, with the potential for significant gains if the reversal completes as expected.

Kusama (KSM)Technical Analysis of KSM/USDT - Analyzing Movement Within a Descending Channel
Market Overview:
KSM is currently moving within a gently sloping descending channel. This channel has previously acted as a significant resistance zone around the 53.76 - 66.57 range, leading to notable price reversals. This zone is considered a key resistance level, and whenever the price hits this area, it has historically corrected back towards the channel's midpoint.
🔴 Volume Analysis:
A decrease in trading volume at this stage indicates weakness from the sellers, which could signal a potential price reversal to the upside.
Bullish Scenario:
If the price manages to break through the PRZ (Potential Reversal Zone), there is an increased likelihood of a strong upward movement towards Fibonacci targets. If this occurs, we could expect the price to reach the following levels:
1.618 Fibonacci: 99.26 - 127.69
2.618 Fibonacci: 292.71 - 371
3.272 Fibonacci: 495.95 - 628.6
✔️ Resistance Break Confirmation:
To confirm this bullish move, we need to see an increase in volume as the price breaks through the green resistance zone.
🔔 Key Note:
If the PRZ is breached, this bullish movement could continue. However, if the price fails to break through this area, there is a risk of a correction back towards the channel's midpoint or even the lower boundary of the descending channel.
Bearish Scenario:
If the price fails to break through the PRZ, we may see further corrections with the price moving back towards the lower boundary of the descending channel. In this downward move, the 15 - 16.84 range could act as key support, preventing further price declines. However, if this support is lost, there could be a potential drop to lower levels, such as 10.5 or even 7.8.
🟢 Support Bounce Confirmation:
In this case, monitoring volume and candlestick reactions could provide good signals for a potential price reversal from support zones.
RSI Analysis:
On the weekly timeframe, the RSI is moving within an ascending channel and has currently reached the middle of the channel (49.79 - 52.96 range). If the RSI holds this level, we could see the price move towards the upper end of the channel (60 - 65 range).
✅ RSI Support Hold:
If the RSI finds support at this level, a bullish price move is likely.
❌ RSI Break Below:
If the RSI falls below this level, we may see further price declines, with the RSI heading towards the lower part of the channel (40 - 45 range).
⚡ Important Note:
Paying attention to the price's reaction to the RSI support zone, along with volume, can provide key signals to confirm the future trend.
Key Points for Decision-Making:
Volume at Resistance Zones: An increase in volume during the break of the green resistance zone could confirm the continuation of the bullish trend.
Price Reaction to the PRZ: A break above the PRZ resistance zone would strengthen the bullish trend.
RSI Support Level: Maintaining support at the RSI level could act as a catalyst for further upward movement.
Risk Management: If the price fails to break through the PRZ, further corrections could occur. Using support levels like 15-16.84 could be an opportunity for re-entry.
Conclusion:
The technical analysis of KSM/USDT shows that the price is currently moving within a descending channel with key resistance and support zones. Paying attention to volume and RSI reactions can help you make better decisions when entering or exiting the market. Currently, volume and confirmation of the PRZ breakout are the most important factors in determining the future direction of the price. 🚀📊

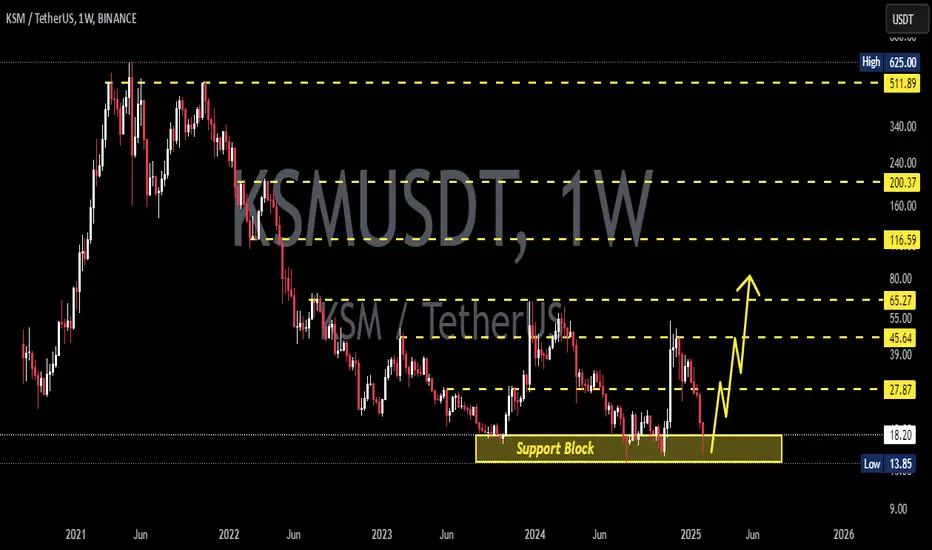
KSMUSDT 1WKSM Update ~ 1W
#KSM So far it continues to maintain its bullish structure. This is a very good support block for the next bull run. heading towards the wave 3. Buy in stages here with a minimum target of 20%++
TradeCityPro | KSM: Ascending with Key Breakouts👋Welcome to TradeCityPro!
In this analysis, I will review the KSM coin. This project is part of the Polkadot ecosystem and the analysis is conducted on a 4-hour timeframe.
⏳ 4-Hour Timeframe: Price Correction After Reaching Significant Resistance
In the 4-hour timeframe, after breaking the $22.17 level, the price executed a sharp and substantial uptrend, even managing to breach the resistance at $29.16 and reaching up to the $47.82 area.
🔍 After testing this area twice, the price entered a correction phase and dropped in two legs, first to $33.33 and then to $29.16. With a fake break of the $29.16 support, the bearish momentum in the market decreased, and currently, the price is forming a new structure.
📊 A very important note for the bullish trend is that during the entire correction phase, the volume of candles has been gradually decreasing, and it has now reached its lowest state. The approaching Christmas holidays have also undoubtedly influenced the decrease in volume, and the price may continue to range within this area until the end of the holidays.
🔽 If a third bearish leg occurs, the first trigger is $33.33, which we should wait to see how the price reacts to this area to define it more precisely and become a more reliable trigger. The next trigger is $29.16, which is a significant support. If the price stabilizes below this area, the next support will be at $22.17.
✨ A break below 40.20 in the RSI will aid the entry of bearish momentum, increasing the likelihood of breaking future supports.
📈 Conversely, given the reduced market volume, the bullish momentum in the market remains active. If the trend continues, breaking above 40.58 will be the first trigger. Entering a position upon this trigger helps ensure peace of mind in case of breaking the $47.82 resistance or failing to do so, as the risk of opening the position is accepted beforehand.
✅ The bullish target upon breaking $47.82 is the $59.68 resistance, which will be the initial target of the movement. If this target is reached, I will update the analysis and specify new targets for you.
📝 Final Thoughts
This analysis reflects our opinions and is not financial advice.
Share your thoughts in the comments, and don’t forget to share this analysis with your friends! ❤️

KSM/USDTKey Level Zone : 35.50 - 36.00
HMT v3.0 detected. The setup looks promising, supported by a previous upward/downward trend with increasing volume and momentum, presenting an excellent reward-to-risk opportunity.
HMT (High Momentum Trending):
HMT is based on trend, momentum, volume, and market structure across multiple timeframes. It highlights setups with strong potential for upward movement and higher rewards.
Whenever I spot a signal for my own trading, I’ll share it. Please note that conducting a comprehensive analysis on a single timeframe chart can be quite challenging and sometimes confusing. I appreciate your understanding of the effort involved.
If you find this signal/analysis meaningful, kindly like and share it.
Thank you for your support~
Sharing this with love!
HMT v2.0:
- Major update to the Momentum indicator
- Reduced false signals from inaccurate momentum detection
- New screener with improved accuracy and fewer signals
HMT v3.0:
- Added liquidity factor to enhance trend continuation
- Improved potential for momentum-based plays
- Increased winning probability by reducing entries during peaks

KSM/USD KSM/USDTThe idea was made a long time ago, and I forgot to post it, but we can see how it's being realized in the medium term

#KSM/USDT Ready to go higher#KSM
The price is moving in a descending channel on the 1-hour frame and sticking to it well
We have a bounce from the lower limit of the descending channel, this support is at 29.50
We have a downtrend on the RSI indicator that is about to be broken, which supports the rise
We have a trend to stabilize above the 100 moving average
Entry price 30.47
First target 31.76
Second target 34.00
Third target 36.26


Kusama (KSM): Possible Fill of CME Gap!Kusama coin has formed a perfect etup here where, with the recent break of EMAs, we have now re-tested the zone of EMAs, filling also the FVGs in the upper zones, where the price now shows some signs of weakness.
We are looking at that smaller resistance zone as we expect to see full-scale rejection and a possible move towards the CME gap!
Remember, if we break the resistance, then this trade will be invalid!
Swallow Team

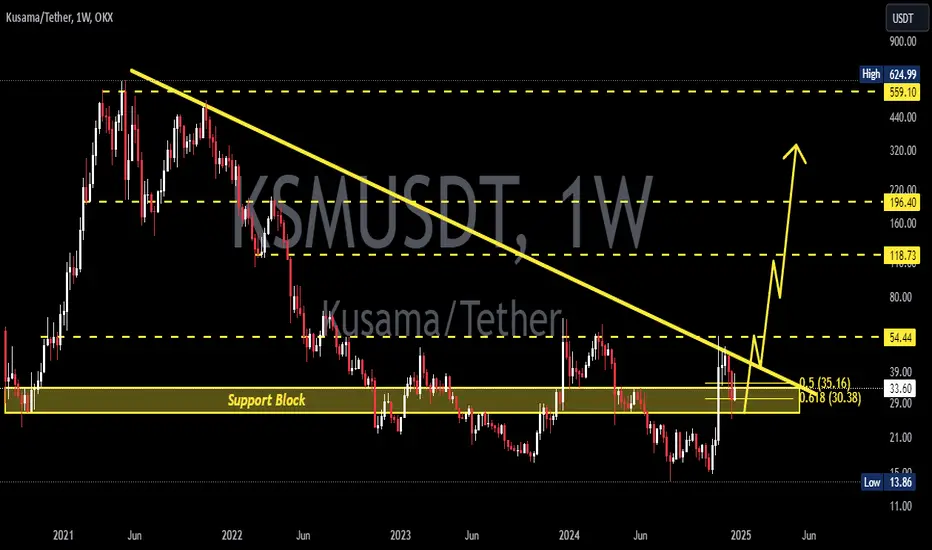
Long trade idea for KSMUSDTLong trade idea for KSMUSDT
Falling Wedge measured from DEC 2023
Potentially min 912% profit from current date. Target $513
Do note potential pullback according to purple line.
Note that there are Bearish Order Blocks as shown.
Do exercise due diligence and that all trades comes with risks

KSMKSM-USDT
Buy entry from the current price 🟢 and if any correction occurs, we support from the price of $40.850
Objectives:
$58.8
$92
Stop loss:
$38

