BP Price Prediction Price forecast in white
This is on the weekly chart so a trade isn't to be executed
this is just an analysis of the chart on a larger scale
price forecast on this weekly chart is in white
0HKP trade ideas

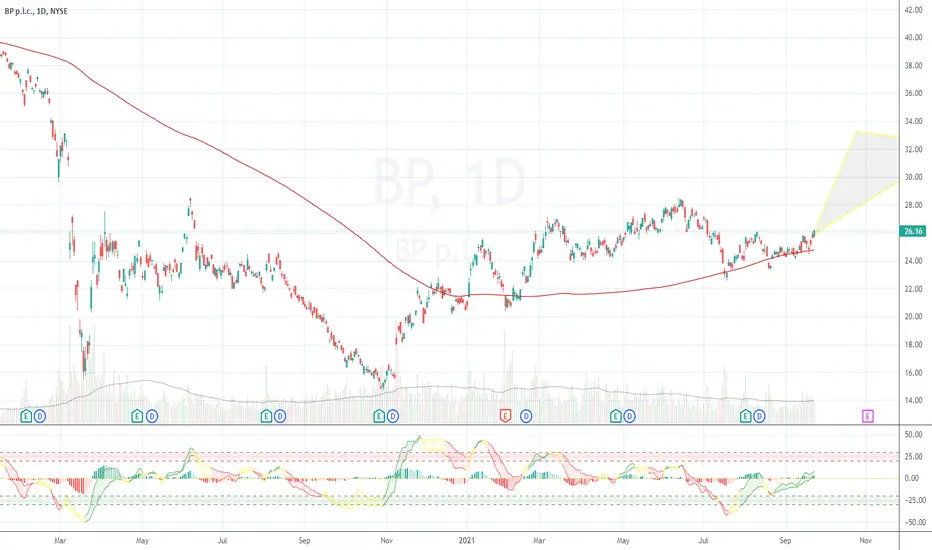
BP: Rising Wedge with MACD Hidden Bearish DivergenceWe are trying to hold a demand line of a rising wedge pattern but are showing clear Hidden Bearish Divergence on the Daily and are likely to rollover rather than hold and upon breaking down one would expect it to come down to fill the gap below us at around $15.50

British Petroleum (NYSE: $BP) Ready To Break Out 🐻-ish Wedge! BP p.l.c. engages in the energy business worldwide. It operates through Gas & Low Carbon Energy, Oil Production & Operations, Customers & Products, and Rosneft segments. It produces and trades in natural gas; offers biofuels; operates onshore and offshore wind power, and solar power generating facilities; and provides de-carbonization solutions and services, such as hydrogen, and carbon capture, usage and storage. The company is also involved in the convenience and mobility business, which manages the sale of fuels to wholesale and retail customers, convenience products, aviation fuels, and Castrol lubricants; and refining, supply, and trading of oil products, as well as operation of electric vehicle charging facilities. In addition, it produces and refines oil and gas; and invests in upstream, downstream, and alternative energy companies, as well as in advanced mobility, bio and low carbon products, carbon management, digital transformation, and power and storage areas. BP p.l.c. was founded in 1908 and is headquartered in London, the United Kingdom.


Will BP be able to regain its former glory or fall is inevitableToday we will look at the chart of the price movement stocks of British Petroleum , BP, British Petroleum Corp. - a corporation that for many years has been among the leaders of the oil and gas, petrochemical and coal industries on all continents.
They had an interesting history of BP stock pricing in accordance with the events in the world at that time. Therefore, we will share our observations.
1) When the world was affected by the "First Oil Crisis" in 1973, the share price dropped threefold from $3.50 to $1.13 , where the historical minimum was set.
2) However, already during the "Second Energy Crisis" — the Islamic Revolution in Iran in 1979-1980, the value of BP shares increased threefold from $4 to $12. Then the corporation was actively exploring new deposits on different continents of the world, which allowed it to diversify such risks as the revolution in Iran or the nationalization of their assets in Nigeria in 1979.
3) Although in 2000-2010 the value of British Petroleum shares reached its maximum of $80 , nevertheless, a number of man-made disasters took place in the corporation, the maximum in power among which was the explosion of a tower in the Mexican Gulf in April 2010. Then the value of shares and capitalization collapsed by 56%
4) It would seem that it could not be worse, but 2020 proved that there can be, and a 63% drop in the value of shares of there proof.
First, the CoviD crisis (late 2019 — early 2020), then the negative value of WTI oil futures and a general decrease in demand for oil and oil refining materials from cars and aircraft, forced the corporation to fix a loss in 2020 at $5.7 billion , however, they predicted -$4.8 billion
British Petroleum's annual reports are considered almost inside information. They predict that by 2050 the demand for "clean" energy from renewable resources will increase from the current 5% to 55-60%. Accordingly, companies that do not have time to implement a high-quality and smooth energy transition from oil, gas and coal to the production of "clean" energy from renewable resources are doomed to fall.
Finally, our thoughts on the possible future price of BP's stock.
For ourselves, we single out the level of $20, as critical.
Fixing the price above this level will suggest that the corporation is making an energy transition according to the schedule, and, accordingly, the price of shares may rise to $36 , to begin with.
If the BP stock price starts trading below $20 , it means that something is wrong in the company and soon this news will be available to everyone and in general, and the value of the shares themselves may fall to $10-12


BP PLC Sweden Europe Sun Storm Investment Trading Desk & NexGen Wealth Management Service Present's: SSITD & NexGen Portfolio of the Week Series
Focus: Worldwide
By Sun Storm Investment Research & NexGen Wealth Management Service
A Profit & Solutions Strategy & Research
Trading | Investment | Stocks | ETF | Mutual Funds | Crypto | Bonds | Options | Dividend | Futures |
USA | Canada | UK | Germany | France | Italy | Rest of Europe | Mexico | India
Disclaimer: Sun Storm Investment and NexGen are not registered financial advisors, so please do your own research before trading & investing anything. This is information is for only research purposes not for actual trading & investing decision.
#debadipb #profitsolutions
30 Million Shares of BP Post Russian Withdrawal BP is still a macro energy play despite the weeks long sell off. For all you options traders out there looking out for a bottom in commodities markets this might be it. DISCLAIMER No bags, everything was sold two weeks ago, please look at macro & geo-political events before making ANY decisions.


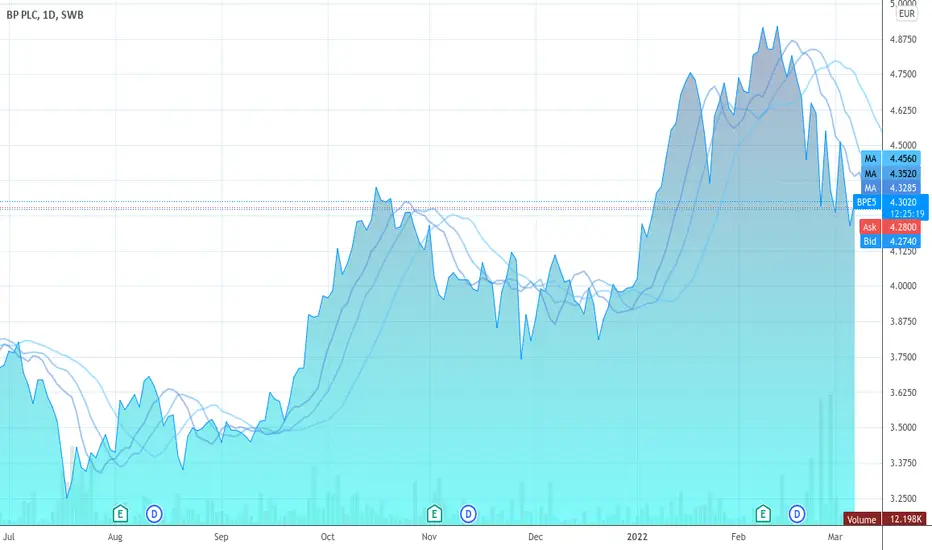
BP p.l.c stock analysis - bullish trendSwing-Trade analysis (1d chart)
SMMA-Analysis & Support and Resistance:
- The 100er SMMA (yellow) seems to be used as a major support line since the middle of August 2021.
- Golden Cross (bullish breakout pattern): We can see how the 50 SMMA (white) cut the 200 SMMA (red) in the end of October 2021. If the 100er SMMA cuts the 200er before the 8th of February (Earnings & Revenue Disclosure), we have another strong buy signal.
- The green line shows a mid-term resistance at 3,95 USD
Chart-Pattern:
- We see a bullish channel (thin yellow lines) - if you extend the lines to the left, you can clearly see that the channel started in November 2020.
- We also see a symmetrical triangle (thin white lines) which might indicate a bullish continuation if the upper line is going to be cut; or reversal if the lower line is going to be cut. However, it seems that investors are waiting for the 8th of February, because the triangle closes in that area.
Momemtum Indicators:
RSI: No divergence detected. RSI moves around 50 for a while which means that the stock is neither overbought nor oversold.
MACD: The histogram turns to the green zone which indicates the market is increasing in buying momentum. MACD line rises above the signal line, the indicator gives a bullish signal, which suggests that the price of the asset is likely to experience upward momentum.
CVO OBV: No divergence detected. However, the histogram is above zero since the beginning of December which confirms an upward momentum.
Conclusion:
Based on the findings we see an upward continuation. I would place a long position before the earnings report at around 4 USD. Possible Sell-order might be at around 4,3 USD (below the annual high of 2021) or even higher.
Stop-loss should be placed on the 100er SMMA. A more conservative stop-loss might be the 0.236er FIB at 3,834 USD.
Last but not least, It seems that investors are waiting for February earning results, and for this reason my analysis should be taken with a grain of salt.


BP PLC USA Sun Storm Investment Trading Desk & NexGen Wealth Management Service Present's: SSITD & NexGen Portfolio of the Week Series
Focus: Worldwide
By Sun Storm Investment Research & NexGen Wealth Management Service
A Profit & Solutions Strategy & Research
Trading | Investment | Stocks | ETF | Mutual Funds | Crypto | Bonds | Options | Dividend | Futures |
USA | Canada | UK | Germany | France | Italy | Rest of Europe | Mexico | India
Disclaimer: Sun Storm Investment and NexGen are not registered financial advisors, so please do your own research before trading & investing anything. This is information is for only research purposes not for actual trading & investing decision.
#debadipb #profitsolutions

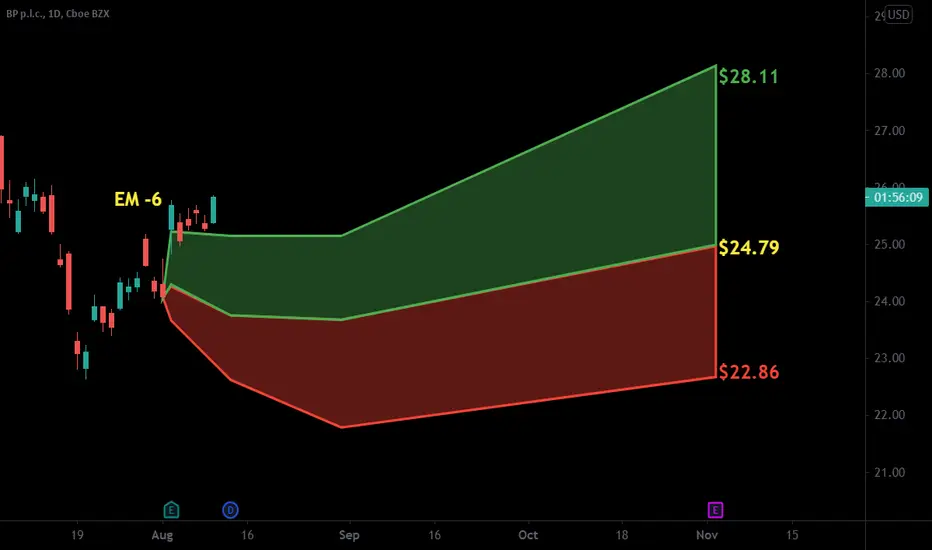
$BP with a Bullish outlook following its earnings #Stocks The PEAD projected a Bullish outlook for $BP after a Negative Under reaction following its earnings release placing the stock in drift D.
If you would like to see the Drift for another stock please message us. Also click on the Like Button if this was useful and follow us or join us.

Long on PB - Trading is simple but not easy. Trading is simple but not easy. Really anyone can do it. Here are my rules
- Use a 3 chart correlation to trade the bigger picture & filter out market fluctuation.This will help to control your emotions & control trigger fingers.
- scan the market for low risk (Rs) and high reward (Rw) trades. a ratio of 1 to 3 is minimum. Find places where Support & Resistance are unbalanced.
- identify a trend on the long term chart for example monthly (M). and wait for a correction on the middle trade chart (W), this is the principal chart you will be trading. once identifies, you can use a lower trade chart to time your ENT for example Daily (D
- Enter (ENT) on low risk window & dont chase it. be willing to let it go
- Set your STP & be ready to take the small loss. If the trade is profitable take profit at profit target 1 (PT) & let the rest run. use a trailing STP to let winners run.
In this trade. PB is one a newly formed uptrend on the long-term chart (M) the middle trade chart (W) is in a correction. The Rs to Rw ratio is a minimum 1 to 3, I CLS full position at PT1.


Long BP- incredible low 9 PE ratio
- they are investing in offshore and onshore wind energy, carbon, hydrogen, and many different types of renewables
- a ton of cash on hand
- just reported a great quarter
What’s not to love? In a world that’s starved for value and energy companies are the most important

$BP with a Bullish outlook following its earnings #Stocks The PEAD projected a Bullish outlook for $BP after a Positive over reaction following its earnings release placing the stock in drift B
If you would like to see the Drift for another stock please message us. Also click on the Like Button if this was useful and follow us or join us.