Natural Gas In Trouble (Part 3/3)Many participants rushed into OXY because of Warren Buffett, and the Buffett-related spike on 19 August now looks like a trap to lure in latecomers into the oil&gas space. Any breakdown from a mini flag pattern could lead to a swift move to key $57 neckline.
0KAK trade ideas


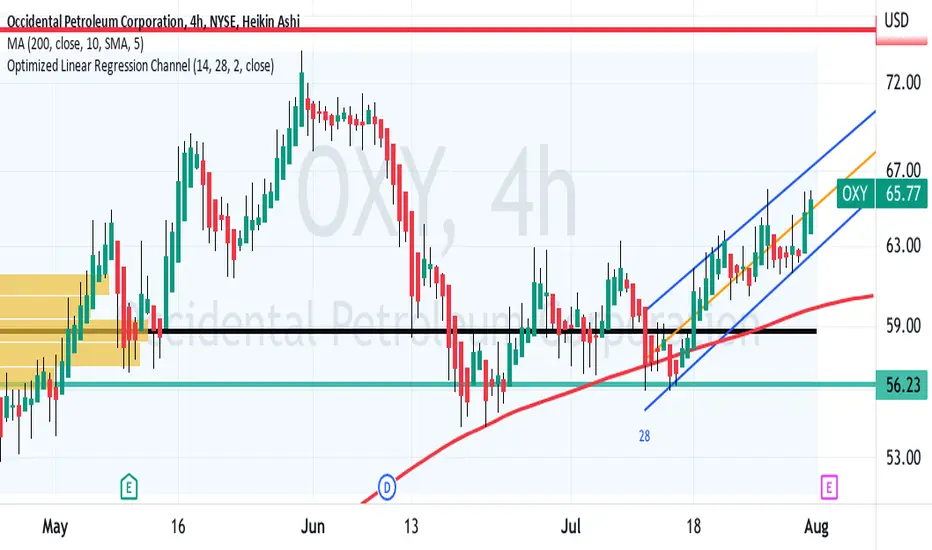
Occidental Petroleum: Is it Time to Go Back to the Well?Occidental Petroleum is the biggest gainer in the S&P 500 this year, but was the biggest decliner last week. Is the dip an opportunity for the bulls?
The first pattern on today’s chart is the surge to a new 52-week high in late August. It is one of only 12 S&P 500 members to hit a new high in the last two weeks (and the only energy company.) That relative strength may reflect interest by large investors.
Second, the dip since then has bought OXY back to its 50-day simple moving average (SMA). Notice how that line was support in the spring and resistance over the summer. Can it bounce there again?
The stock is also back to the $64 area where it peaked in July and paused before breaking out in August. Some traders could now view that price zone as potential support.
Next, you have an outside day on Thursday and an inside day (with a hammer) on Friday. That may suggest OXY is attempting to stabilize.
Fourth, the succession of higher lows in June, July and August could suggest its longer-term uptrend remains in effect.
Finally, stochastics have dipped to an oversold condition.
TradeStation has, for decades, advanced the trading industry, providing access to stocks, options, futures and cryptocurrencies. See our Overview for more.
Important Information
TradeStation Securities, Inc., TradeStation Crypto, Inc., and TradeStation Technologies, Inc. are each wholly owned subsidiaries of TradeStation Group, Inc., all operating, and providing products and services, under the TradeStation brand and trademark. You Can Trade, Inc. is also a wholly owned subsidiary of TradeStation Group, Inc., operating under its own brand and trademarks. TradeStation Crypto, Inc. offers to self-directed investors and traders cryptocurrency brokerage services. It is neither licensed with the SEC or the CFTC nor is it a Member of NFA. When applying for, or purchasing, accounts, subscriptions, products, and services, it is important that you know which company you will be dealing with. Please click here for further important information explaining what this means.
This content is for informational and educational purposes only. This is not a recommendation regarding any investment or investment strategy. Any opinions expressed herein are those of the author and do not represent the views or opinions of TradeStation or any of its affiliates.
Investing involves risks. Past performance, whether actual or indicated by historical tests of strategies, is no guarantee of future performance or success. There is a possibility that you may sustain a loss equal to or greater than your entire investment regardless of which asset class you trade (equities, options, futures, or digital assets); therefore, you should not invest or risk money that you cannot afford to lose. Before trading any asset class, first read the relevant risk disclosure statements on the Important Documents page, found here: www.tradestation.com .

Warren Buffett Given Regulatory OK To Buy 50%Warren Buffett has been steadily buying this stock over the last few months and now owns 26.8%
With regulatory approval now allowing him to own up to 50% will be interesting to see where this stock ends up.
Indicators look good. Price at a support area, RSI showing good value, and MACD looks like momentum might be coming back into the stock after its recent pullback.
One way to buy this kind of stock could be with a stop or a stop limit order so if it does wiggle up on open then you enter the trade. If it does break through resistance and head downwards then your order wont trigger and you wont be in the trade.
Could be worth keeping an eye on and adding it to your watchlist to do more research.

Gentleman's OXY?Got FOMO'ed in b/c WEB kept buying? Take measure to protect yourself from a potential drop in the short term:
It started with negative divergence in March, noticing that volume did not follow through after the breakout, it might end up with a H&S formation that project to the low 40's (blue lines).
That region happens to coincide with:
- the yellow trendline with multiple tops in the past, which can now function as support;
- an interesting retracement level;
- a volume profile wedge.
This is a short term set up based on technical, invalidation above 70.
With the intention to (partially) take over, it makes sens for a whale to keep buying regardless whether price goes up or down.
Assess your own situation as it might differ.

OXY Maintaining my position and moving my take profit to 104 USDOXY Maintaining my position and moving my take profit to 55 USD.
Warren Buffett's Berkshire cleared by regulators to buy up to half of Occidental Petroleum stock -- WSJ.
Occidental Petroleum Corp.'s shares jumped to lead the S&P 500, up 9% after the Federal Energy Regulatory Commission said that Warren Buffett's Berkshire Hathaway Inc. had asked for and recieved its permission to buy up to 50% of the oil producer's shares.
The average price target of stock analysts according to Tip Ranks is on 76 USD or 2 STD above the 200D EMA. That is the next resistance and a good level to sell. Nevertheless, I'm more bullish after this news and the geopolitical tensions in Europe that could cause a severe shortfall of LNG.
Source: Dow Jones Global News

OXY SHORT after bouncing down from All Time ResistanceOXY as shown on the chart is still in a megaphone pattern.
Horizontal resistance red line is the all time highs of Spring 2018.
In the past several trading sessions, spot oil has dropped from $96 to $87.
The MACD indicator which is lagging shows the K / D cross over the histogram.
Accordingly, OXY is now trending downward to the mid-Fibonacci retracement levels
and the confluence of the mid-line of the megaphone pattern.
This appears to be a safe short trade setup especially now that the buying
pressure of Mr. Buffet has subsided.

Is OXY topping at resistance ? ( Possible Reversal )OXY has run up quite well, especially with the help of heavy buying from Warren Buffet and his conglomerate.
Is it set up for a downturn?
On the chart, the red horizontal line is the market high pre-Covid.
The MACD a lagging indicator has the K and D lines in early convergence
well above the histogram.
Time will tell but OXY might be pulling back into a better price for buying.


OXY Going to $80+ by end of AugustI have been watching OXY the past two weeks and I have strong evidence that the stock will rally to monthly highs. My personal contract target is $85 September 9 Calls.
Give this one more time, it has been consolidating the last week after Buffet's news but I think we have more buying to come. Notice how even when the market dropped 1,000 points last Friday, OXY was still holding strong above 50% ownership rumor levels ($75+).
Personal Target - $88.00+ by end of September.
Not to be deemed as financial advice.

OXY - LonggRecent News
Warren Buffett’s Berkshire Hathaway on Friday received regulatory approval to purchase up to 50% of oil giant Occidental Petroleum. This caused the massive candlestick on 19th Aug.
Fundamental
Profitability:
OXY's Return On Assets of 14.82% is among the best in the industry. OXY does better than the industry average Return On Assets of 5.23%.
OXY's Return On Equity of 39.51% is among the best in the industry. OXY does better than the industry average Return On Equity of 24.13%.
OXY has a Profit Margin of 32.48%. This is better than the industry average of 16.24%
Valuation:
Price/Earnings Ratio: 9.64
Forward Price/Earnings Ratio: 9.17
Growth:
Earnings Per Share - In the last year, the EPS has been growing by 626.21%.
Earnings Per Share - Measured over the past 5 years, EPS has been growing by 29.36% on average per year.
Revenue - Measured over the last 5 years, Revenue has been growing by 20.70% yearly.

Impending Breakou (WEEKLY)OXY has been on fire this year and its looking to go higher. On the weekly OXY is looking to breakout of its previous high set at 73 in May. MACD is curling up and RSI is looking to go upwards as well. Very bullish closes over the past two weeks. Looking for it to hold above 75 this week before I enter.

OXY Sellers Fall Down ( Flat Bottom Triangle Breakout) LONGNYSE:OXY
One hour chart: NYSE:OXY
In the past day, the relative volume of sellers has decreased
and price momentum is gradually increasing despite
the general market reaction to federal economic news.
The flat bottom triangle breakout suggests sellers are capitulating
on pricing given current circumstances. The RSI Oscillator
is in a mid-range suggesting more upside.
I see a long setup with call otpions 2 weeks expiration strike $85.

Occidental USA SSI Live Trading Series
Sun Storm Investment Trading Desk & NexGen Wealth Management Service Present's
Focus: Worldwide
By Sun Storm Investment Research & NexGen Wealth Management Service
A Profit & Solutions Strategy & Research
Trading | Investment | Stocks | ETF | Mutual Funds | Crypto | Bonds | Options | Dividend | Futures |
USA | Canada | UK | Germany | France | Italy | Rest of Europe | Mexico | India
Disclaimer: Sun Storm Investment and NexGen are not registered financial advisors, so please do your own research before trading & investing anything. This is information is for only research purposes not for actual trading & investing decision.
#debadipb #profitsolutions

8/24/22 OXYOccidental Petroleum Corporation (NYSE:OXY)
Sector: Energy Minerals (Oil & Gas Production)
Market Capitalization: 69.778B
Current Price: $74.91
Breakout price: $75.60
Buy Zone (Top/Bottom Range): $71.55-$65.95
Price Target: $85.50-$86.60
Estimated Duration to Target: 30-33d
Contract of Interest: $OXY 10/21/22 85c
Trade price as of publish date: $2.87/contract

OXY Early Breakout from FLAT BOTTOM TRIANGENYSE:OXY
OXY has market momentum with the ongoing Buffet buying frenzy.
It has been in a pattern since the spring 2022 Buffet buying that is a flat bottom
triangle. The latest buying seems to be resulting in
a breakout from the triangle yet without retest.
Rising relative strength on the RSI serves to validate the move.
Buffet seems to know that the current inflation is a headwind for growth
for the alternative energy sector while Big Oil is drowning in cash
and buying back stock relentlessly. A
ll in all , OXY IS A STONG BUY even if spot oil and futures prices are drifting lower.
if the retest fails and OXY returns to the triangle in conjunction with
oil prices decreasing and the general market sideways, I will take
some put options for a few months.


$OXY - Bump & Run Reversal PatternKey intakes on this market:
- In a confirmed uptrend since beg 2022.
- In a longer term downtrend since 2011, as portrayed by the downward sloping, neat trendline.
- Bullish momentum at 10 year highs.
- Price currently providing another touch to this trendline and threfore in an inflection zone, in a value area. The price breaks out (and closes) = probable direction north. The price fakes out = probable direction south with logical places to place your targets and stop losses prominent in this chart.
- Best for last. Type Bump & Run Reversal o Google and then get back to this chart. Spoiler: it is one of the most powerful reversal patterns.
But hold on your horses, that bearish candlestick fromed last July is far from appealing. Corrections are normal, but a true bullish signal within a correction would have been lack of interest from the bears. That's not what that candle displays.
Also note that there is an humagouns supply pool in the 85-90$ area. Just pull the higher timeframe chart and look at that bearish impulse starting at the end of 2018.
Above all, remember that in trading there are no certainties. There are just probabilities. And a good probability of success here, say 65%, would entail that there is a 35% chance you lose your equity. Manage risk! be diligent and responsible!


OXYOccidental Petroleum rallied strongly on Friday with a high of $72.49. Hence a daily close above this level could propel prices towards either $76.75 or $82.16, both being Fibonacci Extension’s 1.272 and 1.618 levels derived from $72.49 and $56.83. However, a daily close below $64, which coincidentally the EMA20 day level, could present short selling opportunities. First downside support is $56.83 while second support is seen at $51.53.

OXY spiked and started to break outHighlighted previously a couple of weeks ago, OXY just spiked 9.88% on Friday.
The weekly chart shows some consolidation and then a two week bullish candle stack. The MACD crossed over in bullish territory and this bullish run has an upside projection target of >100, a good 30% from last trading close.
The daily chart similarly has technical indicators turning bullish with crossovers in the RPM, and in the MACD.
Clearly bullish... perhaps with some technical retracement, and then a relaunch and then a good break.
Wait and watch for it!
PS. in some ways, I wonder if this remotely has any indication that Crude prices might be spiking soon again... just wondering.

OXY and W.iv) of (iii) Ext.I have taken large profits from OXY with rising wedge pattern. However, I have been following this stocks for a long time by counting EW. It's likely forming on W. iv) of (iii). This wave 5 has possibility to be 5th wave Extension. So, I made the trading plan regarding to Elliott Wave possibility. The TP is a rather challenging but my risk calculation is reasonable. Thus, the trading plan is worth taking. Good Luck+

