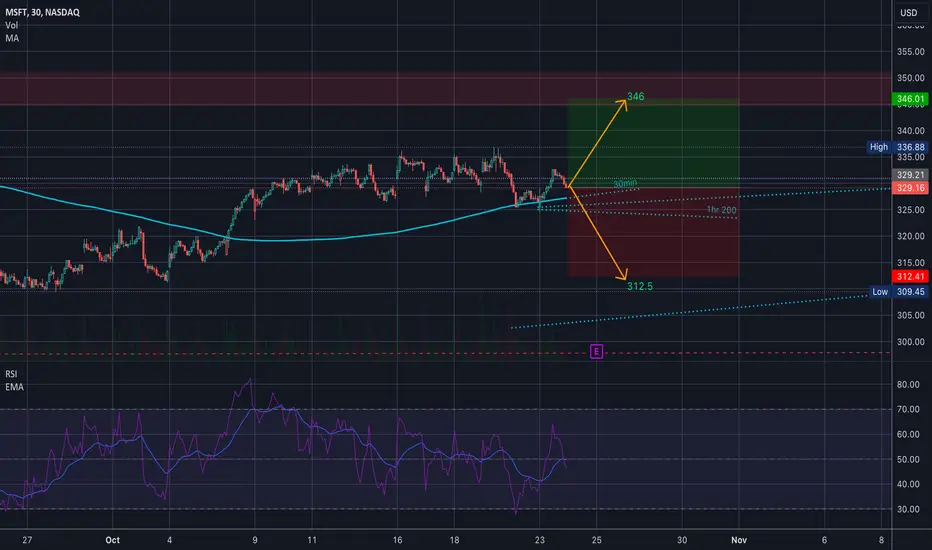
$MSFT Implied move for earningsNASDAQ:MSFT Implied move for earnings
WOW… the MSFT chart is beautiful. I haven’t looked at it in a few weeks and something about it is calming to my mind…
This is not an in depth anlysis… this is just the implied move for earnings…. Which is 312.5 to 346…. and RSI is right in the middle...
But I might have to spend a little more time on this chart in the next few days….
Happy trading, y’all…
0QYP trade ideas


Microsoft's Remarkable 33% YTD Growth: A Deep Dive into Its ProsMicrosoft's Remarkable 33% YTD Growth: A Deep Dive into Its Prospects
Microsoft Corporation has been on a remarkable journey in 2023, with its shares showcasing an impressive year-to-date growth of 33%. This ascent has caught the attention of investors for several compelling reasons. As a tech giant, Microsoft has not only solidified its presence in the rapidly evolving realm of artificial intelligence (AI) but has also demonstrated remarkable resilience to economic challenges, setting it apart from many industry peers. In addition to these strengths, Microsoft's standing as a dominant player in the software sector, with a portfolio that includes iconic brands such as Windows, Office, Azure, and LinkedIn, further enhances its appeal.
Despite its strong performance earlier in the year, the tech market has experienced a modest downturn over the past three months. This market correction has led to a 7% dip in Microsoft's stock value since July, aligning it with declines witnessed by competitors like Apple and Amazon. This adjustment in stock price presents an opportune moment for investors to delve deeper into the growth potential of a high-performing company like Microsoft and consider it as a prospective investment.
Here are three crucial insights that savvy investors should be aware of regarding Microsoft:
Enormous Earnings Potential in AI:
Microsoft's strategic investments in the AI domain have been nothing short of visionary. In 2019, the company committed $1 billion to OpenAI, the developer behind ChatGPT, and later increased its stake to 49%. This partnership has given Microsoft access to cutting-edge AI technology, allowing the integration of AI-powered features throughout its software portfolio.
In July, Microsoft indicated that investors should expect "gradual" revenue growth from its AI offerings in fiscal 2024. However, considering the sheer dominance of Microsoft's brand portfolio and the advanced capabilities of OpenAI, this projection may underestimate the actual impact and potential of AI-driven revenue growth.
Wedbush analyst Dan Ives has observed a significant surge in activity on Microsoft's cloud service, Azure, following the introduction of AI tools. This uptick could potentially lead to a remarkable 25% revenue growth for Azure in the first quarter of 2024. Given that Azure already experienced substantial 19% year-over-year growth in fiscal 2023, this projection seems reasonable. Furthermore, Microsoft 365 is set to introduce an AI assistant called CoPilot, available for $30 per month as an add-on to existing subscriptions. Microsoft's strong foothold in cloud computing and productivity software positions it favorably to diversify its AI offerings and capitalize on this thriving industry.
Attractive Valuation Relative to Other AI Stocks:
While chipmakers like Nvidia and Advanced Micro Devices (AMD) have garnered significant attention in the context of AI growth, their stocks have witnessed substantial increases of approximately 198% and 59%, respectively, since the start of the year. These companies play pivotal roles in AI hardware development, but their recent surges have led to elevated stock prices. In comparison, Microsoft appears to offer better long-term value.
A key metric for evaluating stock value is the forward price-to-earnings (P/E) ratio. A P/E ratio below 20 is typically considered undervalued, and Microsoft is the closest to this figure among prominent AI players. Moreover, Microsoft's substantial investment in OpenAI and its dominance in various market segments suggest similar or even greater earnings potential within the lucrative AI industry. Microsoft's steady stock growth and consistent earnings growth make it an attractive choice, especially as expected earnings growth may already be reflected in the valuations of its peers.
Reliable Dividend Growth:
Microsoft stands out for its consistent dividend growth, boasting an impressive streak of 19 consecutive years of increases. Over the years, the company's dividend has grown from a modest $0.08 in 2003 to a substantial $0.68 in 2022. Recently, Microsoft announced another dividend hike, exceeding 10% to reach $0.75. While Microsoft's dividend yield of 0.87% may appear modest compared to leading dividend stocks like Verizon, it surpasses the yields of its tech competitors. Amazon and Alphabet offer no dividends, while Apple's dividend yield stands at 0.56%.
Microsoft's sustained commitment to dividend growth underscores management's unwavering confidence in its financial outlook. This, combined with its consistent stock appreciation, positions Microsoft as an appealing choice for long-term investors seeking both stability and growth potential.
In conclusion, Microsoft's journey in 2023 has been marked by significant achievements and a noteworthy stock performance. Its strategic investments in AI, attractive valuation relative to AI peers, and reliable dividend growth make it a compelling choice for investors looking to capitalize on the company's strong position in the tech industry and its promising prospects in the field of artificial intelligence. As the tech landscape continues to evolve, Microsoft remains a key player to watch for both its resilience and innovation.
Our preference
The upside prevails as long as 285.85 is support.

Microsoft 23/10 MovePair : Microsoft Corp
Description :
Symmetrical Triangle as an Corrective Pattern in Short Time Frame , Rejecting from the Upper Trend Line and Demand Zone. Completed Impulsive Waves and Corrective Waves " abc " , If it Breaks the Lower Trend Line and Retest then it will Short
Entry Precaution :
Wait for the Proper Rejection with Strong Price Action


💵 E a r n i n g s J o u r n a l📶 S T A T I S T I C A L A N A L Y S I S
Current 50-Day Market Trend: sideways/holders/neutral.
Next Swing: neutral swing of volatility.
Next Wave: buy wave to the ceiling.
Next 50-Day Market Trend: long/buyers/positive.
Trade Type: Touch & Go don't wait for a close.
💵 E A R N I N G S A T A G L A N C E
Release Date: 10/24 AMC
Quarter: FQ1'24
_______________________________________________
Revenue Anticipations: positive surprise of Revenues.
Revenue Surprise-Confidence: on a scale of 0-9, #4
Revenue 2-Year Trend: the company trend in Revenues is positive.
_______________________________________________
EPS Anticipations: positive surprise of EPS.
EPS Surprise-Confidence: on a scale of 0-9, #5
EPS 2-Year Trend: the company trend in EPS is positive.
_______________________________________________
📝 S Y N O P S I S
🟢BUY: If the earnings report is above the Wall Street consensus, I expect the market will buy the +surprise.
⚪NEUTRAL: If the earnings report is released with complicating press, I expect the market will avoid the surprise and invest in alternative securities.
🔴SELL: If the earnings report is below the Wall Street consensus, I expect the market will sell the -surprise.
🔎 R E S E A R C H D E P T H
Technical Analysis: daily chart.
Fundamental Analysis: EPS & Revenue data.
Press/News: none.
Social Media: none.

Natural Gas Price Forecast & 7 Mega Cap Tech Stocks Forecast00:00 Natural Gas stock Bulls NatGas Support & Resistance Guide
02:34 AMEX:UNG Stock Forecast
04:04 USO Oil Stock Forecast
05:34 Gold XAUUSD Stock Forecast
06:37 US dollar DXY Stock Forecast
07:47 Silver XAGUSD forecast
09:22 QQQ Stock Price Forecast
11:28 Sp500 ETF Price Forecast
13:25 Tesla Stock TSLA Forecast Technical Analysis
14:50 Nvidia Stock NVDA Forecast Technical Analysis
17:14 Apple Stock AAPL Forecast Technical Analysis
18:00 Amazon Stock AMZN Forecast Technical Analysis
18:57 Google Stock GOOGL Forecast Technical Analysis
19:46 Microsoft Stock MSFT Forecast Technical Analysis
21:29 Meta Forecast Technical Analysis

Price Action Range Here we have a trade idea that came from a price action range. The idea is simple, we have a price action range that popped above and fell right back into the range. Also had a liquidity grab towards the downside. The target will be right under the liquidity grab. The reason being is we can expect price to go down near/pass this level because the liquidity grab used up all the liquidity at that area therefore making it easy to pass

MICROSOFT: No buying before the Resistance breaks.Microsoft made an important bullish breakout as it crossed over the LH trend-line of the Falling Wedge last week and turned bullish on the 1D technical outlook (RSI = 58.105, MACD = 2.380, ADX = 32.602). The last sell signal is near the dotted top of a potential Channel Down pattern. As long as it holds, we are taking the sell and target the 1D MA200 (TP = 313.00). On the contrary, if the price closes over the R1 level (341.00) we will go long and target the R2 level (TP = 366.50).
The fact that the 1D MA50 is holding is certainly a build up to a bullish trend potentially. As is the Bullish Cross on the 1D MACD, which by the way is on a Bullish Divergence (HL) against the LL of the stock price.
## If you like our free content follow our profile to get more daily ideas. ##
## Comments and likes are greatly appreciated. ##

MSFT Showing Strength on Retest Ahead of EarningsPercentage of Shares Held by Institutions is a bit low at 69% for NASDAQ:MSFT stock right now. However, the indicators are showing some strength as it retests the lower level of resistance above its current price.
NASDAQ:MSFT reports earnings next week on Tuesday. Microsoft has focused on AI for small businesses, the market niche that helped move it out of its 16-year slump until 2016, and during the pandemic. The pandemic anomalies in revenues should be patterned out this earnings season.
The stock has ample support at the most recent lows. It is a heavily weighted component of all 3 indexes, so an important report for Q3.

$MSFT Falling Wedge? Bullish Breakout Ahead?It looks to me that NASDAQ:MSFT is in a Falling Wedge Pattern. Often these resolve to the upside. It looks to me that NASDAQ:MSFT is testing the top of that wedge now. This may be one you want to watch. I have an alert set for a move over $332.60. If it triggers, I will look at a lower timeframe for an entry. This may have a run-up before earnings which are in about 13 days (I have not verified the date.)
Ideas, not investing / trading advice. Comments always welcome. Thanks for looking.
According to Investopedia:
Some studies suggest that a wedge pattern will breakout towards a reversal (a bullish breakout for falling wedges and a bearish breakout for rising wedges) more often than two-thirds of the time, with a falling wedge being a more reliable indicator than a rising wedge.

$MSFT - 15 min 2 steps for Bullish Scenario with T1S Indicator:
1. Candles Above the Green Line:
• Check that the candles on the chart are positioned above the green line of the T1S indicator. This could be an indication of bullish momentum.
2. Bars Above Zero:
• Ensure that the bars on the T1S indicator are above zero. This condition might suggest positive market sentiment or upward price movement.
2 steps for Bearish Scenario with T1S Indicator:
1. Candles Below the Green Line:
• Verify that the candles on the chart are positioned below the green line of the T1S indicator. This condition may indicate bearish momentum or a potential downward trend.
2. Bars Negative Below Zero:
• Confirm that the bars on the T1S indicator are in the negative territory and located below zero. This setup suggests a negative market sentiment or downward price movement


Microsoft’s $69 Billion Activision Blizzard cleared by Britain LONDON - Britain finally cleared Microsoft (NASDAQ:MSFT)'s $69 billion acquisition of Activision Blizzard (NASDAQ:ATVI) on Friday after it forced the Xbox owner to sell the steaming rights to games including "Call of Duty" to address its competition concerns.
The deal was blocked in April by the Competition and Markets Authority (CMA) which said it could give the U.S. computing giant a stranglehold over the nascent cloud gaming market.
But the regulator ripped up its play book by reopening the case after Microsoft agreed to sell the streaming rights to Activision's games to Ubisoft Entertainment, with remedies to ensure the terms were enforceable.
The deal was the biggest test of the CMA's global power to take on the tech giants since Britain left the European Union.
It said "sticking to its guns" in the face of criticism from the merging companies had delivered an outcome that was better for competition, consumers and economic growth.
The approval paves the way for Microsoft to close the deal by Oct. 18 after it extended the deadline to secure UK approval.
The CMA said Microsoft's concession on streaming was a "gamechanger", adding that it was the only competition agency globally to have delivered this outcome.
The new deal will stop Microsoft from locking up competition in cloud gaming as this market takes off, preserving competitive prices and services for UK cloud gaming customers," it said in a statement.
Microsoft announced the deal in early 2022, aiming to boost its growth in console, mobile, PC, and cloud gaming to compete with the likes of Tencent as well as PlayStation-owner Sony (NYSE:SONY).
The U.S. Federal Trade Commission opposed the deal but after failing to stop it, the CMA was left standing alone.


Microsoft Breakout?Often MSFT can lead the market.
If this stock is breaking out of a daily range it will likely help propel the indices and cloud stocks higher.
With the second largest company in the world showing technical strength, one has to sway slightly more bullish.
if this breakout fails than one can lean more bearish. As of now this is a bullish move for MSFT

Microsoft - Neutral / ShortDid not notice that bearish weekly close that week. Pretty nasty candle. I am not advising a short here since we are $30 off the highs already. However, if you are looking to buy the safest area risk / return wise is $300 but more ideally the $285 area.
Typically when 7-10 stocks lead the entire market its bearish for the future, I am getting concerned we are approaching that point despite the nasdaq looking strong overall.
My strategy isnt about timing the market but buying and selling value/euphoria. Hence the idea above.


[S-018] MicrosoftTrading idea number S-018 | Microsoft stock could fall to $293 area.
The configuration is negative. The RSI is below the neutrality area at 50. MACD is below its signal line and negative. In addition, the stock is below its 20-day and 50-day moving averages. Finally, Microsoft trades below its lower daily Bollinger band.
📉 Short Entry at 310.88
💰 Take Profit at 293
💸 Stop Loss at 320

"Microsoft's Quantum Leap: How Quantum tech can shape the futureMicrosoft's Quantum Leap: A Bullish Trend on NASDAQ
Microsoft (MSFT) is experiencing a bullish surge on NASDAQ. The Relative Strength Index (RSI) for MSFT indicates strong buying momentum, with levels well above the 70 threshold, signaling an overbought condition and potential for further gains. The Simple Moving Averages (SMA) show a golden cross, with the 50-day SMA crossing above the 200-day SMA, a classic bullish signal. This suggests strong upward momentum and investor confidence in Microsoft's strategic investments in cloud computing, AI, and quantum computing. As technology continues to evolve, MSFT appears well-positioned for sustained growth.

Been playing with 30DTE $MSFT Options, and I'm cautiously LONGBackground
- Been playing with 30DTE MSFT Options for the last 3 months, and I'm cautiously LONG since buyers always seem to buy at Bollinger Bands ranges rather than let it drop below those ranges, regardless of Earnings, News Cycles, or Open Trading Windows.
Growth Fundamentals
1. MSFT is a major holder in OpenAI pre-public stock
2. OpenAI: Will continue to benefit from first mover advantage at scale + API adoption (now part of many workflows)
3. Azure: Continues to benefit from cloud infrastructure adoption
4. Office: Continues to benefit from increased knowledge worker population
🧠 IMHO this combination is what will help us get to annotation #3. (Consumer hardware and gaming business is probably not going to make a significant difference any time soon.)
Technical Analysis
1. Weekly chart shows lots of support levels between now and 312.
2. Expecting buyers to come support 325 and bring us back to the "triple tap" level.
3. I believe we could also range here for awhile due to macro-uncertainty.
Investment Buy and Hold Potential:
1. Certainly a good pickup for the long haul, as MSFT sells to global markets, and has moats in across several different business solutions.
2. AI and Cloud Infra will continue to bring in revenue.
3. Most people are likely comfortable holding MSFT stock if they get assigned
4. Looking for AMEX:SPY to hit $470 before taking profits
