Lisk / Bitcoin
0.00000368BTCR
+0.00000005+1.38%
Last update at Jul 9, 23:46 GMT
BTC
No trades
LSKBTC trade ideas

Lisk Is Looking Strong #Lisk #LSKThere are three parts to any cycle...
Breakout...
Breakdown...
Flatline...
and then BAM!!!
its just that easy to get paid!
Stay Cryptic Ya'll.
BK


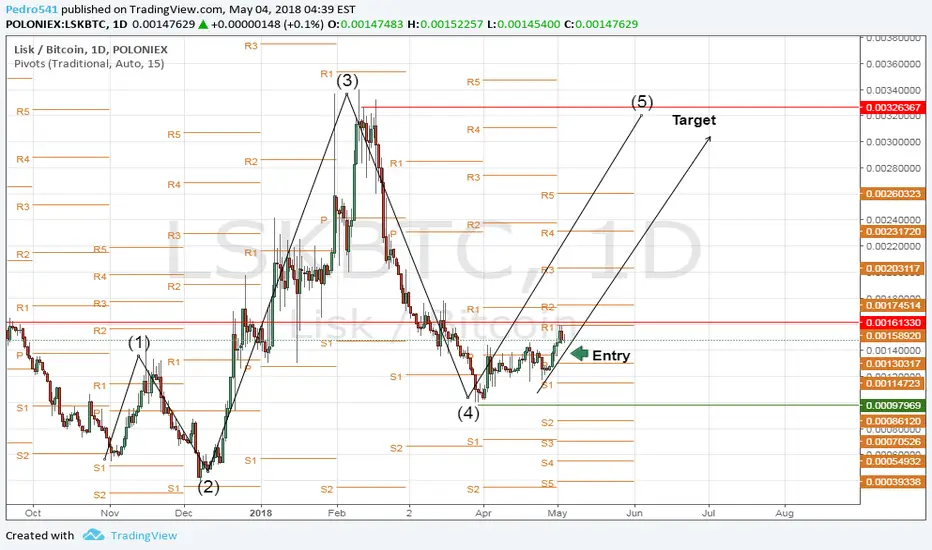
There is possibility for the beginning of uptrend in LSKBTCTechnical analysis:
LISK/BITCOIN is in a range bound and beginning of up trend is expected.
The price is above the 21-Day WEMA which acts as a dynamic support.
The RSI is at 58.
Trading suggestion:
The price is in a range bound, but we forecast the uptrend would begin.
There is possibility of temporary retracement to suggested support zone (0.00122 to 0.00100), if so , traders can set orders based on Daily-Trading-Opportunities and expect to reach short-term targets.
Beginning of entry zone (0.00122)
Ending of entry zone (0.00100)
Entry signal:
Signal to enter the market occurs when the price comes to "Buy zone" then forms one of the reversal patterns, whether "Hammer" or "Valley" , in other words,
NO entry signal when the price comes to the zone BUT after any of reversal patterns is formed in the zone.
To learn more about "Entry signal" and special version of our "Price Action" strategy FOLLOW our lessons:
Take Profits:
TP1= @ 0.00156
TP2= @ 0.00173
TP3= @ 0.00220
TP4= @ 0.00288
TP5= @ 0.00336
TP6= Free


Lisk target and stop lossLisk show Tom de mark green 2+ and 1D stochRSI low so have potencial pump. Lisk waiting 4H slow stochRSI then start pump.
Target : 173932
Stop loss : 119816

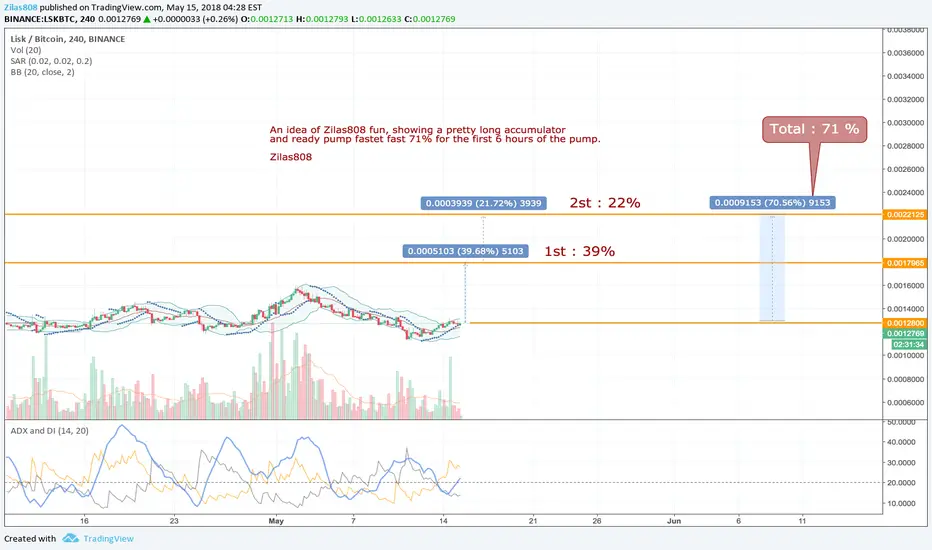
LSK/BTC Pump fastet GO GO PUMP .
I have the hope of a quick Pump boom by accumulating too long. However, if you do not pump, you are always safe to buy this LSK.
BUY 0.00127SAT
SELL 1ST : 0.00180SAT
SELL 2ST : 0.00220SAT .
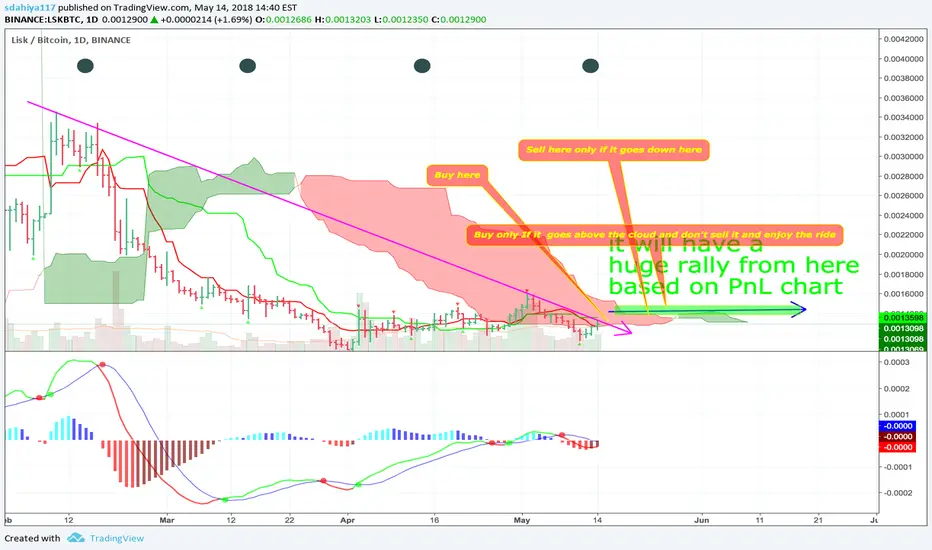
LSKBTC:Hey friends,
Here is my TA for LSKBTC 1.46% .
I know we don't want to miss a huge really from any coins. Lsk can b a good opportunity to make profit. I have had a look at a few coins today and most of the coins are looking extremely good.
RSI is looking good in 1D chart.
Monero, XLM -0.96% , Qtum, Zcash ( only if goes above 333)
I will update you guys on the fly.
please let me know if anyone has different thoughts re this.
Happy Trading :)


A failed trade on LSK - introspection Today, I am going to do an analysis of one of my losing trade. Although winning feels rewarding, if you want to improve, there is no better school than reviewing a setup that failed - understanding where it went bad and what would have been the best solution, was there any mistake? This is a personal introspection of how i felt during the trade, why i entered the position, what would have been the best solution and why I believe this was a bad idea to enter this trade. Please feel free to leave a comment.
The idea was simple, an upward channel started early April (the 2nd) which is one of the easiest set up to be trading. Enter the trade on the lower band and exit the trade when price bounce on the upper band with a nasty 4.6 W/L ratio. I have marked few part of the chart and will explain those points in details.
N.B.:I will study the chart and not talk about the bitcoin crash which was I guess due to the huge btc movement (8.2K BTC) which may have caused the FUD - point 4.
1) I can see the price bouncing on the channel and I "FEEL" confident that the price is going upward in the near future and that was my first mistake! Never trade with your guts, trading is not about winning a single trade with incredible result (200% pump), that's called gambling and you'd better go to the Casino! I strongly believe that trading is a long term game where you manage to win over a long period. Losing happens, the question is "can you win over the long term?". This was a bad timing because the price was still under all 3 EMAs (especially the 55 which is one of my trigger), the cross over of the macd was not sharp and you can see it fluctuating between 0 for 12 hours.
2) that's where i should understand that the market might be going against me, the price is bouncing on the 55 ema and the next candle is red. the price is not going upward anymore and this is a correction/ retracement.
3) The price is breaking sharply under the lower band, my stop loss is triggered. but I know some people are not putting any stop loss (although this is the most important thing!!!) and thus will continue this trade as if i was still holding it.
4) A well known case of "Support becomes Resistance", the price is bouncing on the lower band of the channel, it will most likely decrease sharply again after that movement. if I haven't closed my position, the point (5) is where i should close it.
6) Let's talk about the RSI going down, 6 happens at the same time as 3. this is again a strong signal that the price has not finished it's correction,
Finally, I missed the powerful Elliott waves!! Although moving in a channel, you can argue there are 5 waves and the retracement could go up to 100% at that point. at the present time, it went to the 78,6% level and held that level.
What if I was working and could not monitor the chart, even worse, I didn't put any stop loss... The price went below 0.0011500 ! which means that at some point the trade was a 15% loss! What should I do??
Do you believe the price is going up or down and why?
At the present time, i don't think it is going further down, first because of the MACD divergence, there are lower lows which means that the downward movement pace is slowing down. In addition,I can see that the stoch RSI is increasing sharply (you can compare it to the previous ones). it looks like we have hit the bottom. Because of this, I believe that the correction of the elliott pattern is now finished, and price will now reach the 1st fibonacci extension : 0.0016800.
How I would play it and please bear in mind I am not a financial advisor! Again writing it down will allow me to come back on that thought and analyse my strategy! "I will get better!"
- Waiting for the confirmation candle crossing sharply the 55 EMA, checking the the next low of the RSI is actually above the latest low (Divergence), a sharp cross-over of the MACD- then ladder my buys to lower the overall cost of it.

Lisk buy + selling zonesThere is uncertainty surrounding btc, it's a great opportunity to put low buy orders on alts and profit from the small "FUD". The order has triggered, now looking to sell for profits.

Lisk: Bagholders must exit then rise Watching Lisk for an entry. Possible consolidation here then rise

LSK lookin' to reverseEverything adds up almost perfectly among the indicators right now.
RVI is low and is nearing past levels of strong support. So volatility and downward momentum is decreasing which is bullish. Room to fall then bounce off support.
This is mirrored on the stochastic as well as the TRIX.
We should see the price bounce off the bottom of the ascending channel at the 0.236 fib line before seeing a price extension to roughly the 0.618 level and this is confirmed by the contractions seen in the kumo.

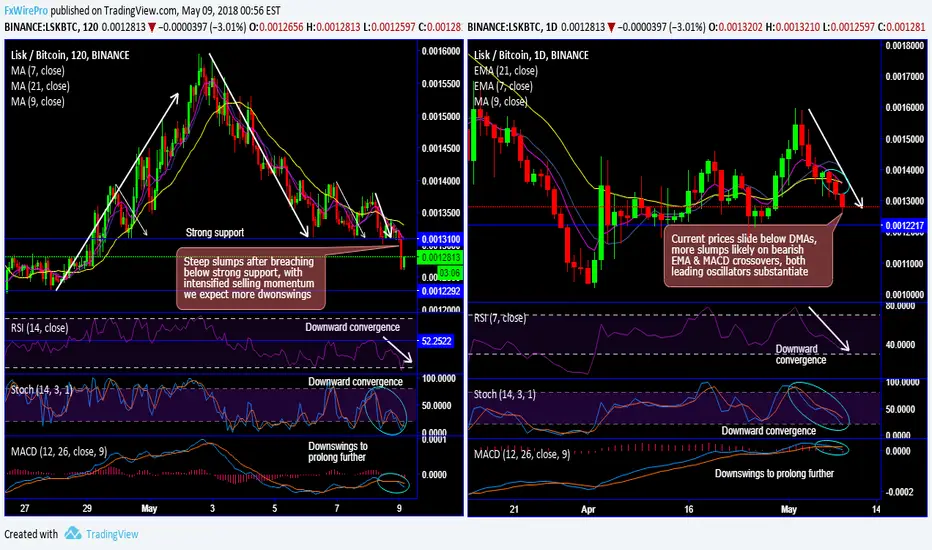
Lisk tumbles on breach of strong support, on verge of 2w lowsAs you could see, LSKBTC at Binance has tumbled with a steep price slump after breaching below strong support at 0.0013100 levels.
Several times in the recent history has shown the strong demand zone at this juncture. Bears have managed to breach decisively below this level, this is backed by intensified selling momentum signaled by both leading oscillators (RSI and stochastic curves).
More slumps below EMAs are expected with most likely EMA and MACD crossovers. 7EMA crosses below 21EMA, while MACD also shows bearish crossover that signal bearish trend to prolong further (refer daily plotting).
However, on the flip side, LSK is one of the currencies to show the rapid spike in its trading volume that in turn has grabbed the attention of the prospective investors. Thus, a huge set of folks from investing class in LSK is observed for quite some time now, we are interested in analyzing all the driving factors for having Lisk as a lucrative avenue of investment. Most evidently, Lisk has teamed up with Abra, Microsoft etc for developmental objectives of its own Blockchain and secured trading platform.
The prime driving factor to own Lisk in a long term is that this cryptocurrency has shown some great stability on the contrary to the recent market trends, even during the severe market crash. Lisk has kept its cool not losing much in response to the majority of tumbling crypto-currencies.
Well, contemplating above technical rationale, as the pair is on the verge of hitting 2-weeks lows, we could foresee short-term selling opportunities, while accumulate longs on dips would be the strategy for long-term.
LSK upward movement ?Here a set up I will probably be trading on the 4 hours chart. A upward channel has taken place for the past 7 days and we do see what could be a bounce to reach the upper limit in the near future.
I can see a bullish RS divergence and the macd almost crossing over on the 4 hours chart which I believe shows that a reversal might take place. Although the volume is not showing the wanted strength yet, there is a bullish engulfing candlestick on the lower limit of the channel only after 1h30. I will enter the trade once i get the confirmation that the reversal is taking place - MACD cross-over/ 55ema cross-over with strong volume. target price around 0.0016 BTC


The beginning of the missile surgeThe beginning of the missile surge
The objectives are illustrated in the diagram

LISK -BTC EN POLONIEX OPCIÓN EN CORTOopcion en corto en próxima vela verde de confirmación
si no se da no entrar.


There is possibility for the beginning of uptrend in LSKBTCTechnical analysis:
LISK/BITCOIN is in a range bound and beginning of up trend is expected.
The price is above the 21-Day WEMA which acts as a dynamic support.
The RSI is at 58.
Trading suggestion:
The price is in a range bound, but we forecast the uptrend would begin.
There is possibility of temporary retracement to suggested support zone (0.00122 to 0.00100), if so , traders can set orders based on Daily-Trading-Opportunities and expect to reach short-term targets.
Beginning of entry zone (0.00122)
Ending of entry zone (0.00100)
Entry signal:
Signal to enter the market occurs when the price comes to "Buy zone" then forms one of the reversal patterns, whether "Hammer" or "Valley" , in other words,
NO entry signal when the price comes to the zone BUT after any of reversal patterns is formed in the zone.
To learn more about "Entry signal" and special version of our "Price Action" strategy FOLLOW our lessons:
Take Profits:
TP1= @ 0.00156
TP2= @ 0.00173
TP3= @ 0.00220
TP4= @ 0.00288
TP5= @ 0.00336
TP6= Free
