#LTC/USDT is testing the Diagonal Trendline in 1-Hour TF!#LTC/USDT is testing the Diagonal Trendline in 1-Hour TF!
CRYPTOCAP:LTC needs to bounce from here. Wait for a bounce to long it. In case of breakdown and retest, we can short it.
LTCUSDT trade ideas

LTC IDEALtc has done C H o C H previous days and turned bullish now. That's why I am looking for long oppertunity and i have found it through one of my favorite setup OB+FVG+SSL. Chart says everything.


LTCUSD Litecoin a Short selling crab market like BItcoinThe cryptocurrency is moving up again, but it will most likely end up in a "crab market."
The term "crab market" is a state where an asset's price moves sideways without significant upward or downward trends.
So do BTC and Litecoin
Bias for both currencies bearish
Rising proces and ralley will be traps: Rising prices with decreasing volumes that will be caused by scalpers, or posers...This short term rallies should be used a higher potentiall of short selling.Falling prices with higher bearish volumes...The bullish moves will be difficult and very slow.
Strategy Short selling
I have marked the stops,and two trading strategy types: Lower Risk and higher Potential but you will need alot of patience to reach your entry.
Type 2 Higher pullback risk, but also higher Profit potential.
Also I have mared the entries, stops and profit targets that could be reached potentially

LTCUSDT-Will Hit 103$ #LTC/USDT has recently experienced a trendline breakout and is currently positioned at a major support level. These factors indicate a strong bullish potential, with an expected price increase of approximately 30% in the coming days.
The price has broken above a significant descending trendline, indicating a shift from a downtrend to an uptrend. This breakout is a strong technical signal that buyers are gaining control and the market sentiment is turning bullish. Additionally, LTC/USDT is currently resting on a major support level, which historically acts as a price floor where buying interest typically increases. The presence of this support level adds confidence to the bullish outlook, as it suggests limited downside risk and a solid base for further upward movement.
The broader cryptocurrency market sentiment can significantly influence the price movement of LTC. Positive trends in the overall market can enhance the bullish outlook for LTC/USDT. Fundamental factors specific to Litecoin (LTC), such as technological upgrades, increased adoption, and positive news or partnerships, can act as catalysts for the anticipated price increase.
Implementing stop-loss orders below the major support level can protect against potential downside risks. A stop-loss level might be set at 5-10% below the support level to account for market volatility. Ensure that the position size is consistent with your overall risk management strategy. Avoid over-leveraging to manage exposure effectively. Proper position sizing helps mitigate the impact of potential losses on your overall portfolio. Establish take-profit orders at intervals that align with the anticipated 30% price increase. Consider scaling out of the position incrementally to lock in profits and reduce the risk of market reversals.
The recent trendline breakout and the positioning at a major support level in the daily timeframe for LTC/USDT suggest a bullish outlook with the potential for a 30% price increase in the coming days. This expectation is supported by strong technical signals and market dynamics. However, it is essential to remain adaptable to changing market conditions and employ robust risk management practices to safeguard investments.
Note: Cryptocurrency trading involves significant risks. Conduct thorough research and consider consulting with a financial advisor before making any trading decisions.

LTC generational bottomLTC is one of the OG coins which has been going sideways for almost 6.5 years. It has formed a double bottom and recently broke a trend line dating back from 2021. LTC is retesting the trend line and will most likely bounce back up. I'm buying more LTC.

Litecoin (LTC): Rejected From 200EMALitecoin is another one on our radar, for the same reason Polkadot was.
200EMA is being tested yet again, and we are seeing high chances of rejection happening from here!
If all plays well, we should see the movement in the next 48 hours, so we are waiting for further confirmation here!
Swallow Team

LITECON UPDATE - SHORT SETUP
now that daily bullish engulfing is what I have been expecting if this was going to be a wave 4-green Triangle. We now have a new invalidation level ($84.18) which presents us with a better risk reward ratio than before (3RR).
PREVIOUS ANALYSIS
OTHER ANALYSIS

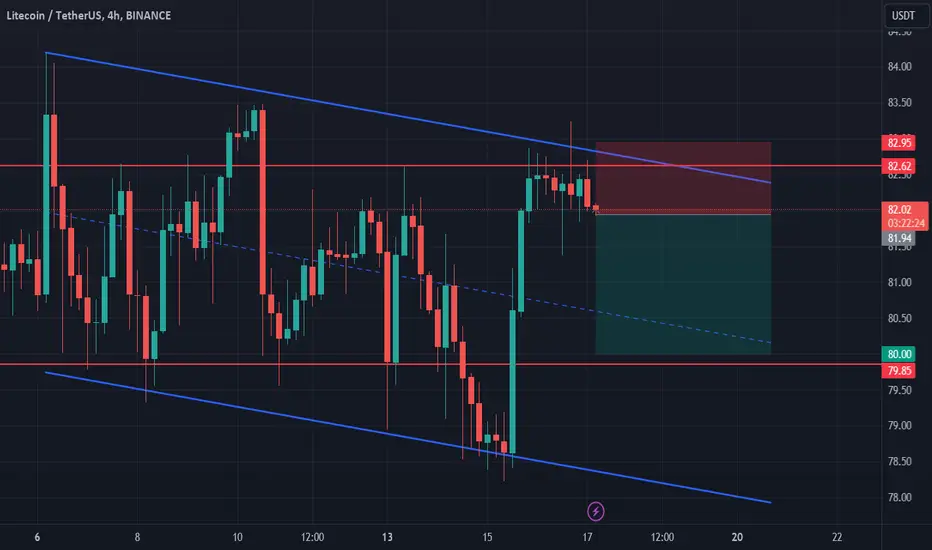
Litecoin shortLitecoin bounced off the upper boundary of descending channel. Asset bounced off the resistance level. Bearish movement to support level 80 is expected to happen.
LTC/USDTThe Bearish Bat pattern is a specific type of harmonic pattern observed in financial markets, particularly in technical analysis trading. It is considered a variation of the Gartley pattern and is formed by a convergence of specific Fibonacci levels. This pattern is named "bat" due to its resemblance to a bat's wings.
Here are the key characteristics of the Bearish Bat pattern:
1. **Initial Move (X to A)**: The pattern starts with a significant price move, labeled as X to A. This move can be either upward or downward.
2. **First Retracement (A to B)**: After the initial move, there is a retracement, labeled as A to B. This retracement usually reaches the 0.382 or 0.50 Fibonacci retracement level of the XA leg.
3. **Second Move (B to C)**: Following the retracement, the price resumes its move in the direction of the initial move, labeled as B to C. This leg typically extends to the 0.886 Fibonacci retracement level of the XA leg.
4. **Final Retracement (C to D)**: After the completion of the BC leg, there is another retracement, labeled as C to D. This retracement typically reaches the 0.382 Fibonacci retracement level of the BC leg.
5. **Completion Point (D)**: The Bearish Bat pattern completes at point D, where the final retracement (C to D) terminates. Point D typically forms at the 0.886 Fibonacci retracement level of the XA leg.
Traders who recognize the Bearish Bat pattern may consider it a potential selling opportunity. They might look for additional confirmation signals, such as bearish candlestick patterns or bearish divergence in momentum indicators, before entering short positions. As with any trading strategy, risk management and proper position sizing are essential when trading harmonic patterns like the Bearish Bat.

LTC PriceThe Litecoin (LTC) triggered a breakdown and breached its critical 200 day EMA support zone in the last session.

LTC continues to lose bullish steamLTC continues to lose bullish steam
The price was brokeout by a complex pattern and currently confirmed a bearish wave.
It may be temporary, but it may also move further down to the second target.
We have seen several times that LTC suffers from the bullish volume problem.
On the other hand also BTC is not clear and it can push all the crypto market down
in this way.
You may find more details in the chart!
Thank you and Good Luck!
❤️PS: Please support with a like or comment if you find this analysis useful for your trading day❤️

Ltcusdt in potential Ascending setupPrice has been forming a series of higher highs and higher lows and this is positive sign and indicates increased demand and confidence among buyers.
Therefore, LTC is very bullish. All attention should be on this immediate support level
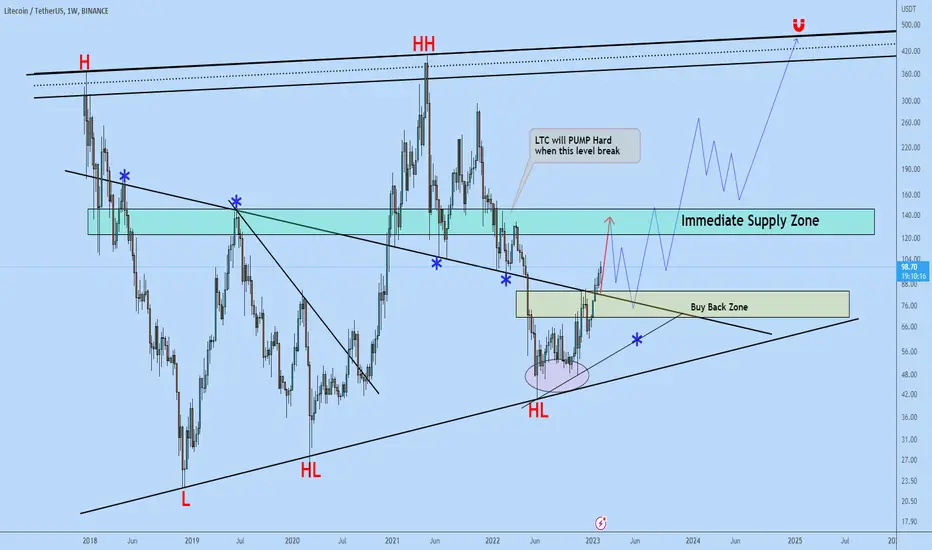

LTC WEEKLY BULLISH CHARTLitecoin chart shows a break could lead to a 140% pump in the coming months, this is a risk you play with spot buying or low leverage.

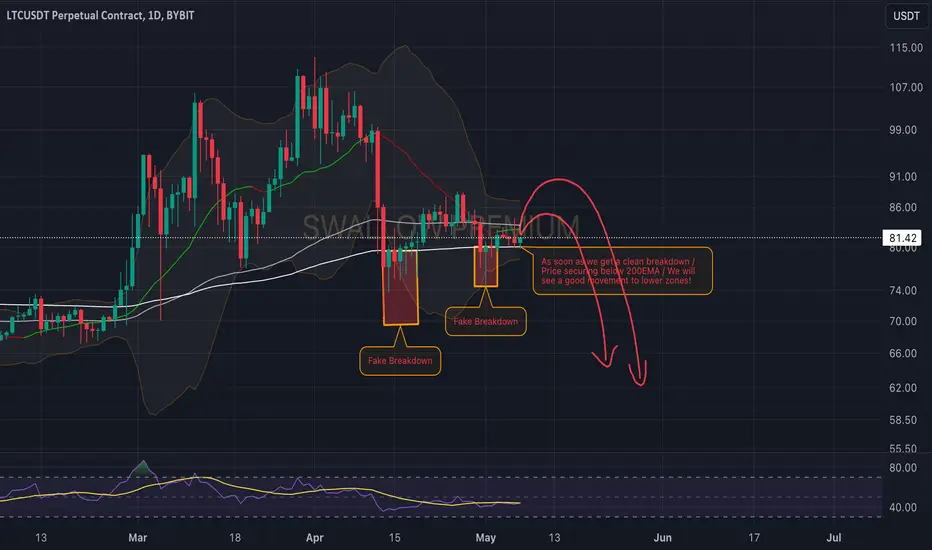
Litecoin (LTC): Keep an Eye on 200EMA!!!!Litecoin is back, and this time in the daily timeframe.
Here, our attention is all on that 200EMA, while multiple times it has been a zone of bounce for the coin.
Pressure is high and demand is high in that zone, so we are looking for any potential candles to secure this zone fully in order to see a full-scale movement to lower zones here!
Swallow Team
LTC (LITECOIN) UPDATE - SHORT TERM TRADE SETUP
This is BINANCE:LTCUSDT update following through on our daily timeframe analysis. It looks as though we are about to end an impulse (context on daily timeframe chart - see below).
Wave 1, 2, 3-green is done. Wave 4 has begun, already created it first wave A, B & C where wave C retraces and has been rejection at the 60% Fibonacci level of wave A which looks like a perfect order block or some other fancy names other analyst call it :).
Now we wait for wave D & E to complete. Meanwhile we could see a push out of the channel close to previous swing high (wave A-blue) at $88 to which would still end up being a Triangle but that scenario is very less likely. Either way the invalidation (red dotted line) is clearly on the chart ($92.97)
More confluence, classically, is the DESCENDING PARALLEL CHANNEL where price has rejected few times (circles) from here on I expect price to start dumping to create some kind of short term temporary support which becomes a sell side liquidity to be taken later. I mean come to think of it, it's weekend so that little usual dump is expected too.
PREVIOUS ANALYSIS
OTHER ANALYSIS

ICT Long setup Swing trade LTCUSDT👋Hello Traders,
Our 🖥️ AI system detected that there is an ICT Long setup in LTCUSDT for scalping and swing trade
Please refer to the details Stop loss, FVG(Demand Zone), Supply Zone for take profit.
For more ideas, you are welcome to visit our profile in tradingview.
Have a good day!
Please give this post a like if you like this kind of simple idea, your feedback will bring our signal to next better level, thanks for support!

✅ A massive rally is comingBullish structure
Pullback completed
BTC & ETH is bullish too
I got long position confirmation

💎 LITECOIN (LTC) - Investment Opportunity (READ THE CAPTION)Upon examining the #Litecoin chart on a weekly timeframe, we can see that the price is currently trading around $81.5 and there is still an opportunity for further analysis for long-term investment. The demand zones are respectively from $67 to $72 and $53 to $59, while the supply zones are $93.8, and from $112 to $134. The targets for this cryptocurrency, in order, are $92.5, $115, $200, and $268.
Please support me with your likes and comments to motivate me to share more analysis with you and share your opinion about the possible trend of this chart with me !
Best Regards , Arman Shaban

Litecoin "the Dragon?" 5824Is Litecoin putting in a dragon pattern? It could be holding this 80 dollar level and doesnt want to let go. We will see soon enough if it takes off to retest the local high. This is where we know if its bull time or time to sell and wait. TBH i think long term holders will win out here. This market is just shaking ppl out to the upside and down. Leverage is the main reason

🌟📉 "Litecoin Analysis: The Oldest Coin in the Market" 📊💰🕵️♂️ Let's delve into the analysis of Litecoin, one of the oldest cryptocurrencies, which has managed to remain in the top 50 coins. We'll analyze it for trading in futures.
📈 In higher time frames, Litecoin remains within its box, similar to some other cryptocurrencies. After breaking the resistance at 109.86, it has the potential to start its upward trend.
⏳ However, in lower time frames, after breaking the 4-hour support line at 95.81 and failing to recover, the price sharply moved towards the main support at 76.16. Currently, it oscillates between 88.27 and 76.16.
🎯 For short positions, we have an important support level at 76.16. After breaking this support, we can open short positions in the direction of the trend and move towards potential targets.
🔄 But for long positions, there are other coins with better conditions, such as near. However, if you want to enter, wait for breaks of the lines at 82.37 and 88.27.
💼 As long positions against the trend are risky, it's recommended to look at short-term perspectives and quickly secure profits. However, after breaking 76.16, you can hold onto more of your positions due to being in the direction of the trend.
🛒 For buying this coin, there is no entry point for now. But if a long-term entry point is seen, we'll update and examine this analysis again.
💪 I personally don't buy this coin. It's one of the oldest cryptocurrencies and is widely accepted in crypto payments. Most sites that accept crypto payments prefer LTC. It has withstood the test of time and remains.
📉 Upcoming supports are at 71.32, 67.69, 64.41, while resistances are at 88.27, 95.81, and the most significant resistance at 109.86.
😊 If you'd like me to analyze a specific coin or currency pair, be sure to comment so that I can allocate the next analysis for you!
⚠️ Also, please remember that I'm just an analyst, and this isn't financial advice. We're here to stay in the market and maximize profits by adhering to risk and capital management principles.

Idea 💡 for LITECOIN LITECOIN has form a bullish triangle pattern, opportunity to enter Long
Sare ur idea with me, Comment
