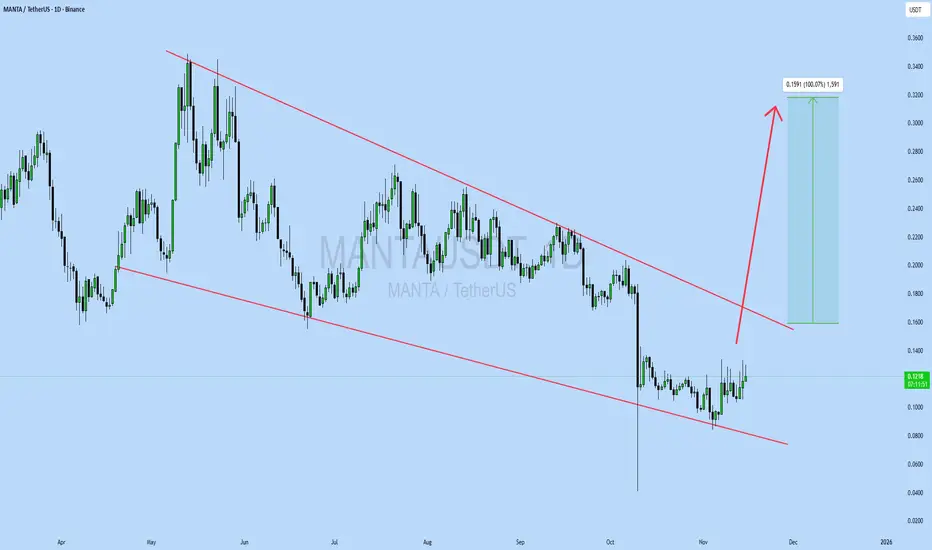
MANTAUSDT Forming Falling WedgeMANTAUSDT is forming a clear falling wedge pattern, a classic bullish reversal signal that often indicates an upcoming breakout. The price has been consolidating within a narrowing range following the earlier decline, suggesting that selling pressure is steadily weakening while buyers are gradually
Related pairs

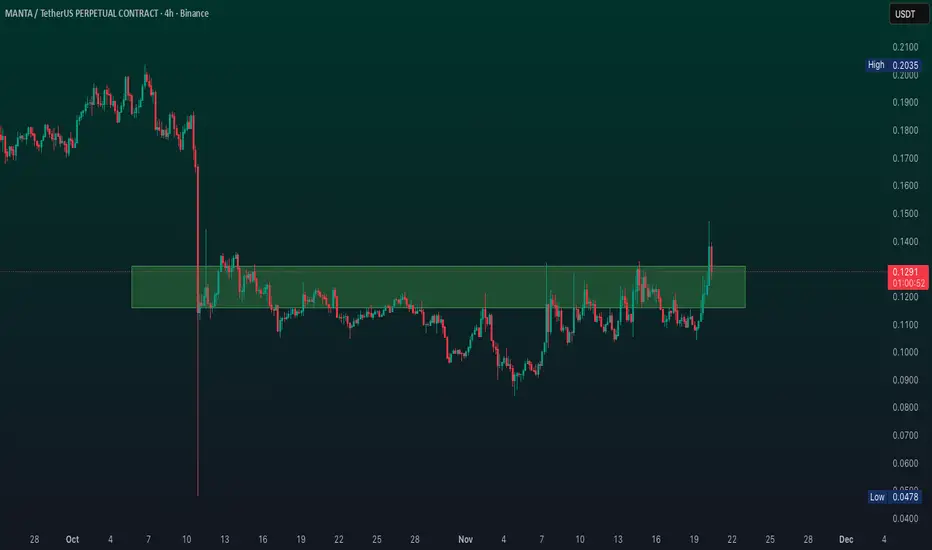
MANTA/USDT – Long Trade Setup (4H). MANTA/USDT – Long Trade Setup (4H)
The price is holding above the rising trendline, indicating a bullish structure.
Strong demand zone around 0.076–0.078, with multiple rejections, buyers are active.
Price is trying to reclaim the 200 MA, which often acts as dynamic support in uptrends.
The overal

MANTA LOOKING STRONG | TECHNICALS BULLISH🔥 Fortune AI Radar — OMXHEX:MANTA
Fresh activity detected on OMXHEX:MANTA today.
Data suggests increasing market interest & buyers stepping in.
Technicals currently lean bullish, with momentum trending upward.
Whales showing hints of accumulation and hype rising among traders.
This coin is fla

#MANTA [RR: 1/5] Price reversal and new growth BINANCE:MANTAUSDT
There is a 5-wave cycle with an elongated 3rd wave and a corrective (protracted) 4th wave.
At the moment, the asset has completed the movement of wave 5 and has shown signs of a reversal in the long direction at the 1.618 extension level.
If we look at W1, we see that the volum

MANATA/USDT - Macro Bottom MANATA/USDT appears to have established a macro bottom, where downside risk is increasingly limited and upside potential is expanding. This is typically the zone where long-term positions are built, not chased.

MANTA/USDT – Long Trade Setup (4H)MANTA/USDT – Long Trade Setup (4H)
Structure: Descending wedge/trendline compression
Ichimoku: Price pushing back into the cloud → momentum stabilizing
MA acting as dynamic support
Long Idea
Entry Zone: 0.0725 – 0.0730
Stop Loss: 0.070
Targets:
T1: 0.0760
T2: 0.0790 – 0.0800
DYOR | NFA

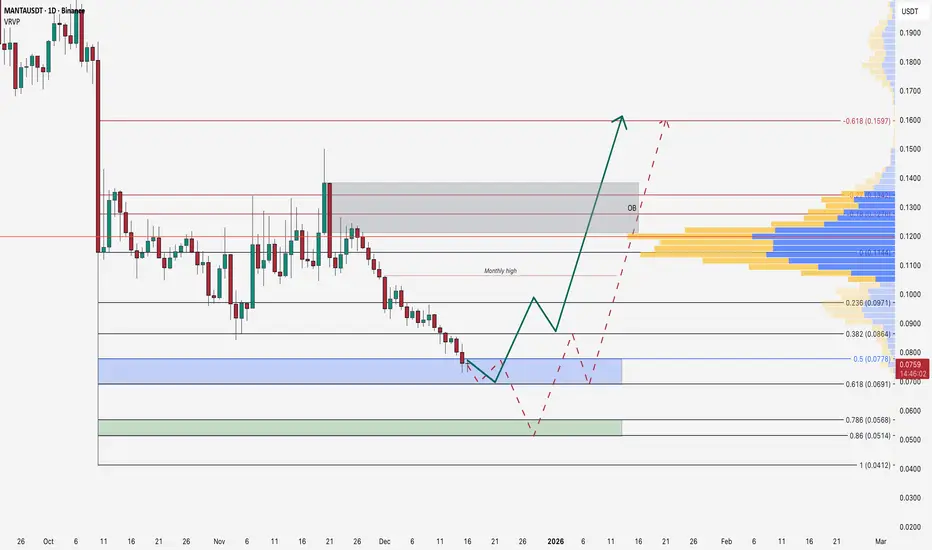
Manta at Discount: Two Scenarios From the 10 Oct WickTwo possible paths for BINANCE:MANTAUSDT based on the Fibonacci levels of the long wick left after the 10 October sell‑off.
Price has been in a steady downtrend and is now trading inside a higher‑timeframe demand zone (blue), which lines up with the 50–61.8% retracement of that October wick move.
KEEP AN EYE ON MANTAOn November 17, 2025, Bifrost launched vMANTA 2.0, enabling cross-chain staking between Ethereum and Manta Pacific with a 20.16% APY. This followed Manta’s October 28 mainnet staking integration with Symbiotic. Technical Rebound Possible due to strong technicals
MANTAUSDT Forming Falling WedgeMANTA/USDT is setting up a very interesting technical picture — price is contracting into what looks like a falling-wedge formation, which often signals a potential bullish reversal. The tightening range, combined with volume that’s beginning to pick back up, suggests that accumulation could be buil
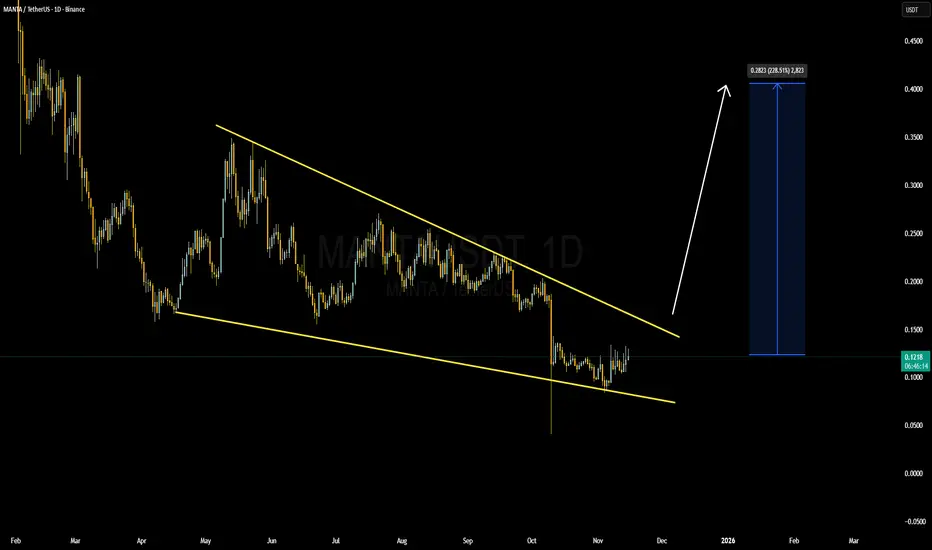
MANTAUSDT UPDATE#MANTA
UPDATE
MANTA Technical Setup
Pattern: Falling wedge pattern
Current Price: $0.1216
Target Price: $0.2807
Target % Gain: 100.07%
Technical Analysis: MANTA is breaking out of a falling wedge pattern on the 1D chart, showing early bullish momentum as price pushes above short-term resistance
See all ideas
Summarizing what the indicators are suggesting.
Oscillators
Neutral
SellBuy
Strong sellStrong buy
Strong sellSellNeutralBuyStrong buy
Oscillators
Neutral
SellBuy
Strong sellStrong buy
Strong sellSellNeutralBuyStrong buy
Summary
Neutral
SellBuy
Strong sellStrong buy
Strong sellSellNeutralBuyStrong buy
Summary
Neutral
SellBuy
Strong sellStrong buy
Strong sellSellNeutralBuyStrong buy
Summary
Neutral
SellBuy
Strong sellStrong buy
Strong sellSellNeutralBuyStrong buy
Moving Averages
Neutral
SellBuy
Strong sellStrong buy
Strong sellSellNeutralBuyStrong buy
Moving Averages
Neutral
SellBuy
Strong sellStrong buy
Strong sellSellNeutralBuyStrong buy
Displays a symbol's price movements over previous years to identify recurring trends.
Frequently Asked Questions
The current price of MANTA / TetherUS (MANTA) is 0.0739 USDT — it has fallen −3.89% in the past 24 hours. Try placing this info into the context by checking out what coins are also gaining and losing at the moment and seeing MANTA price chart.
MANTA / TetherUS price has risen by 2.00% over the last week, its month performance shows a −3.29% decrease, and as for the last year, MANTA / TetherUS has decreased by −86.83%. See more dynamics on MANTA price chart.
Keep track of coins' changes with our Crypto Coins Heatmap.
Keep track of coins' changes with our Crypto Coins Heatmap.
MANTA / TetherUS (MANTA) reached its highest price on Mar 12, 2024 — it amounted to 4.0860 USDT. Find more insights on the MANTA price chart.
See the list of crypto gainers and choose what best fits your strategy.
See the list of crypto gainers and choose what best fits your strategy.
MANTA / TetherUS (MANTA) reached the lowest price of 0.0410 USDT on Oct 10, 2025. View more MANTA / TetherUS dynamics on the price chart.
See the list of crypto losers to find unexpected opportunities.
See the list of crypto losers to find unexpected opportunities.
The safest choice when buying MANTA is to go to a well-known crypto exchange. Some of the popular names are Binance, Coinbase, Kraken. But you'll have to find a reliable broker and create an account first. You can trade MANTA right from TradingView charts — just choose a broker and connect to your account.
Crypto markets are famous for their volatility, so one should study all the available stats before adding crypto assets to their portfolio. Very often it's technical analysis that comes in handy. We prepared technical ratings for MANTA / TetherUS (MANTA): today its technical analysis shows the sell signal, and according to the 1 week rating MANTA shows the sell signal. And you'd better dig deeper and study 1 month rating too — it's sell. Find inspiration in MANTA / TetherUS trading ideas and keep track of what's moving crypto markets with our crypto news feed.
MANTA / TetherUS (MANTA) is just as reliable as any other crypto asset — this corner of the world market is highly volatile. Today, for instance, MANTA / TetherUS is estimated as 6.06% volatile. The only thing it means is that you must prepare and examine all available information before making a decision. And if you're not sure about MANTA / TetherUS, you can find more inspiration in our curated watchlists.
You can discuss MANTA / TetherUS (MANTA) with other users in our public chats, Minds or in the comments to Ideas.