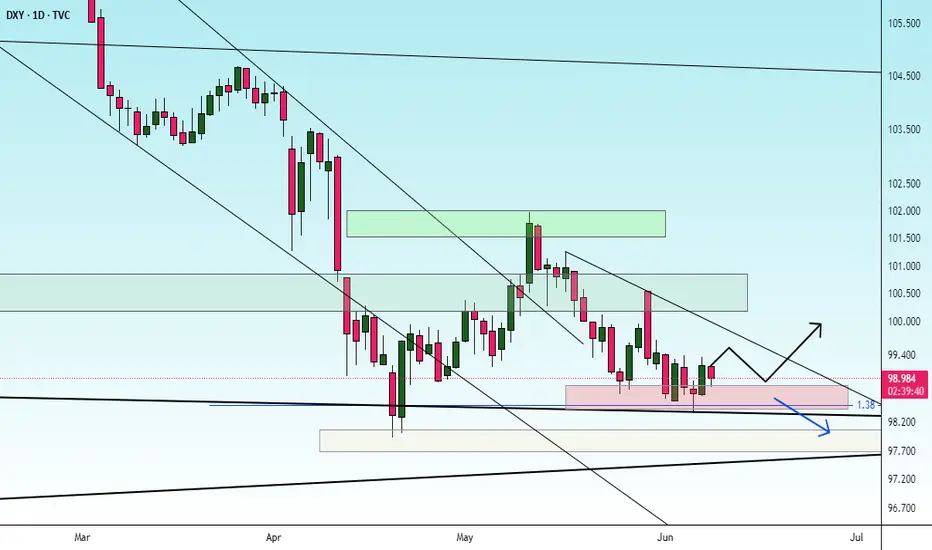
check the trendThe downtrend is expected to end at the current support level and an uptrend will begin. Otherwise, if the support level is broken, the downtrend could continue to the next support level.
US Dollar Index Futures
97.65USDR
−0.18−0.18%
At close at Jun 13, 20:58 GMT
USD
No trades
DOLLARINDEX trade ideas
Is the dollar's a trend or temporary?📊Technical Analysis for:
🕒 Timeframe:
📈 General Trend:
🔍 Analysis Summary:
We are currently observing a rebound from the 98.400 level.
• Major Support Level:
• Resistance Level:
• Technical Indicators: We note that this correction is due to divergence.
🎯 Suggested Entry and Exit Points:
✅ Entry: Upon a breakout/rebound from
⛔ Stop Loss:
🎯 Targets:
• First Target:
• Second Target:
📌 Recommendation:
– It is recommended to wait for confirmation of the technical signal before making a decision.
🛑 Disclaimer:
This analysis is not considered financial advice or a direct buy or sell recommendation. Do your own research and carefully consider risk management before making any decisions.
📥 Do you agree with this analysis? Share your opinion in the comments!
🔁 Follow me for daily analysis. ICEUS:DX1! ICEUS:DX1!

DOLLAR INDEX The higher-than-expected US Unemployment Claims (247K actual vs. 236K forecast) suggest emerging softness in the labor market, increasing the likelihood of Federal Reserve rate cuts in 2025. Here’s how this data impacts the Fed’s policy outlook:
Key Implications for the Fed
Labor Market Cooling:
The uptick in claims aligns with recent trends of slowing payroll growth (Q1 2025 average: 152K jobs/month vs. Q4 2024: 209K) and a stagnant unemployment rate near 4.2%.
Fed projections already anticipate unemployment stabilizing around 4.3% in 2025, but persistent claims increases could signal risks to their "maximum employment" mandate.
Rate Cut Probability:
The Fed has maintained rates at 4.25–4.50% since May 2025 but emphasized data dependence. Weak labor data strengthens the case for cuts, with markets now pricing in a ~60% chance of a September rate cut (up from ~50% pre-data).
The Fed’s March 2025 projections flagged rising unemployment as a risk, with some participants favoring earlier easing if labor conditions deteriorate.
Inflation Trade-Off:
While unemployment claims rose, wage growth remains elevated (ADP reported 4.5% YoY pay gains in May). The Fed will weigh labor softness against sticky inflation, particularly in services (ISM Prices Paid index at 68.7).
A cooling labor market could ease wage pressures, aiding the Fed’s inflation fight and enabling cuts without reigniting price spikes.
Market Impact
DXY (Dollar Index): Likely to weaken further as rate cut expectations rise. Immediate support at 98.40, with a break targeting 97.00
Equities/Gold: Potential gains as lower rates boost risk assets and non-yielding gold.
Bond Yields: 10-year Treasury yields may retreat below 4.40% if markets price in dovish Fed action.
What’s Next?
June 6 NFP Report: A weak jobs number (<150K) would solidify rate cut bets.
June 11 CPI Data: Lower inflation could give the Fed confidence to cut sooner.
Fed Decision (July 31): Odds of a cut rise if labor data continues to soften.
Conclusion
The Fed is likely to prioritize labor market stability over inflation concerns if unemployment claims persist above 240K. While a July cut remains possible, September is the most probable start date for easing, contingent on confirming data.
#DOLLAR #GOLD #DXY


Bullish bounce?US Dollar Index (DXY) has bounced off the pivot and could rise to the 1st resistance.
Pivot: 98.36
1st Support: 97.98
1st Resistance: 99.23
Risk Warning:
Trading Forex and CFDs carries a high level of risk to your capital and you should only trade with money you can afford to lose. Trading Forex and CFDs may not be suitable for all investors, so please ensure that you fully understand the risks involved and seek independent advice if necessary.
Disclaimer:
The above opinions given constitute general market commentary, and do not constitute the opinion or advice of IC Markets or any form of personal or investment advice.
Any opinions, news, research, analyses, prices, other information, or links to third-party sites contained on this website are provided on an "as-is" basis, are intended only to be informative, is not an advice nor a recommendation, nor research, or a record of our trading prices, or an offer of, or solicitation for a transaction in any financial instrument and thus should not be treated as such. The information provided does not involve any specific investment objectives, financial situation and needs of any specific person who may receive it. Please be aware, that past performance is not a reliable indicator of future performance and/or results. Past Performance or Forward-looking scenarios based upon the reasonable beliefs of the third-party provider are not a guarantee of future performance. Actual results may differ materially from those anticipated in forward-looking or past performance statements. IC Markets makes no representation or warranty and assumes no liability as to the accuracy or completeness of the information provided, nor any loss arising from any investment based on a recommendation, forecast or any information supplied by any third-party.

Weekly CLS I Model 2 I Target CLS Highs / OBHey, Market Warriors, here is another outlook on DXY. If you’ve been following me, you already know my setups are based on CLS Footprint, a Key Level, Liquidity and a specific personal execution model.
If you haven't followed me yet, start now.
System is completely mechanical and repeatable— designed to remove emotions, opinions, and impulsive decisions. No messy diagonal lines. No random drawings of multiple patterns Just one setup and market context working on all markets.
🧩 What is CLS?
CLS is real smart money — the combined power of major investment banks and central banks moving over 6.5 trillion dollars a day. Understanding their operations is key to markets.
✅ Understanding the behavior of CLS allows you to position yourself with the giants during the market manipulations — leading to buying lows and selling highs - cleaner entries, clearer exits, and consistent profits.
📍 Model 1
is right after the manipulation of the CLS candle when CIOD occurs, and we are targeting 50% of the CLS range. H4 CLS ranges supported by HTF go straight to the opposing range.
"Adapt what is useful, reject what is useless, and add what is specifically your own."
Please don't gamble on this setup, just because you seen majority of my setups played out. You can never know which trade will work and which not. It's just a probability. Rather take this as opportunity to learn.
David Perk aka Dave FX Hunter ⚔️
👍 Hit like if you find this analysis helpful, and don't hesitate to ask me questions, Im always happy to help others and respectfully discuss other opinions.


U.S. Dollar Index (DXY) Bearish Setup – Supply Zone Rejection & 🔹 Trend Overview
📊 Overall Trend: Bearish (Downtrend)
📉 Price is forming lower highs and lower lows within a descending channel.
🔻 Recently bounced off a support zone, now heading toward a potential pullback.
🔵 Supply Zone (Resistance Area)
📍 Zone Range: 100.049 – 100.601
🧱 Acts as a resistance block where sellers might step in.
📏 Confluent with EMA 70 at 100.178, strengthening its validity.
🔸 Trade Setup – Short Position
🟠 ENTRY POINT: 100.088
❌ STOP LOSS: 100.587 – 100.595 (Just above supply zone)
🎯 TARGET: 98.000 (With intermediate support levels)
📌 Support Levels
🔹 98.112 – First minor support
🔹 98.106 – Close-range confirmation
🔹 97.885 – Additional support zone
🟦 Main Target: 98.000
⚖️ Risk/Reward Ratio
🟧 Small risk above supply zone
🟩 Large reward to downside = Favorable R:R
📌 Summary
📈 Expecting a pullback into supply zone.
🧨 Look for bearish confirmation around 100.088.
🎯 Target the downside at 98.000 for profit.

Monday Market Outlook Get ahead of the markets with this week’s essential macro insights! In this session, we break down the most impactful upcoming events affecting DXY, XAUUSD, and BTCUSD — including the FedWatch Tool outlook, yield curve shifts, and how to interpret changing rate expectations. If you want to understand how the macro backdrop could influence your trades, this video is a must-watch.
👉 Learn how to spot opportunities before the move happens.
📉 Rate cut? 📈 Rate hike? 📊 We’ll show you what the market is really pricing in.

DOLLARThe relationship between the US dollar (USD), the 10-year Treasury bond yield, and bond prices is tightly interconnected and crucial for global markets.
1. 10-Year Bond Yield and Bond Price
Inverse Relationship:
As the yield on the 10-year Treasury rises, the price of the bond falls, and vice versa. This is because the bond’s coupon payment is fixed; when new bonds are issued with higher yields, existing bonds with lower coupons become less attractive, so their prices drop to compensate.
Recent Movement:
In May and early June 2025, the US 10-year Treasury yield rose from 4.18% to around 4.50%, a move of over 30 basis points, driven by strong economic data and expectations that the Federal Reserve will keep rates higher for longer.
2. 10-Year Bond Yield and the Dollar (DXY)
Direct Relationship:
Generally, when the 10-year Treasury yield rises, the US dollar strengthens. Higher yields attract foreign investment into US assets, increasing demand for USD.
Recent Example:
After the stronger-than-expected May jobs report, the 10-year yield jumped to 4.50% from 4.3% on thursday and the dollar index (DXY) also rose, reflecting investor expectations of prolonged high US rates and robust economic performance.
3. Bond Price and the Dollar
When bond prices fall (and yields rise), it often signals expectations for higher interest rates or inflation, both of which tend to support a stronger dollar as investors seek higher returns in USD assets.
Conversely, when bond prices rise (and yields fall), it can indicate economic uncertainty or expectations of rate cuts, which may weaken the dollar.
Key Takeaway
Rising 10-year Treasury yields lead to falling bond prices and typically a stronger US dollar, as higher yields attract global capital seeking better returns.
This dynamic is especially pronounced when strong US economic data or hawkish Fed expectations are in play, as seen in the recent market reaction to the robust US jobs report.
#dxy#dollar #gold

Caution for Dollar Shorts with Middle East Tensions FlaringMy educated guess is that the dollar is moving similar to the first time trump was elected. I am expecting dollar weakness to abate early next year. A major swing low formed in early 2018 one year after Trump was elected first round. Let us see if a similar situation forms next year. For now with DXY structured bearish caution is warranted with Oil up and 10 yr remaining elevated. There is a prior up move in April and until a decisive break below the current area Price Action and circumstances in the middle east warrant caution for dollar shorts.

Follow up on DXY Short post from 2022The DXY follows Fib levels quite accurately on macro movements using the monthly chart. Both on retracement and extension. It has recently tagged the .618 retrace of the last bullish wave 5 movement that started its decline.
I would suppose it is close to completion of wave A of a ABC correction that will play out over the next several months. As it tagged the .618 mentioned above, it has also tagged the .786 extension of what is likely the c wave of the abc structure (of the larger A).
B wave trade to the upside has good probability now in my opinion. I took the trade this morning with a 3-1 RR in place. It could fall to the trend line which is fine, but if it breaks in earnest and closes a few sessions below then my stop would be triggered.
There was a bullish divergence prior to the April lows on the Daily TF and one is developing at the current lows. A close above 99.40 would confirm.
Long term the dollar is likely still going to weaken and go much lower as QE inevitably comes back into the market picture. TP levels are at 99.40, 100.54, 101.25 and 101.76.


What to Expect from CPI Data and the Key Dollar Levels to WatchDollar index trading in a tight range ahead of the CPI data.
US inflation is expected to rise by 0.1% on a yearly basis for both headline and core figures, reaching 2.4% and 2.9% respectively. Markets expect some of the effects of tariffs to begin showing up in this data.
There are both downside and upside risks to the release, but in our view, a slightly lower-than-expected result is more probable. Frontloading of goods before tariffs took place, slowing economic activity, downward price pressure in parts of the services sector due to weaker-than-usual tourism, lower energy costs, and ongoing disinflation suggest that the impact of tariffs may remain limited in this month’s data and possibly the next as well.
If the data remains unchanged and comes in below expectations, the initial reaction could be negative for the dollar due to rising rate cut expectations. However, unless there is a significant surprise in either direction, today’s data is unlikely to meaningfully change the Fed’s economic outlook or rate policy. The inflationary effects of tariffs are expected to appear gradually, due to the frontloading of goods ahead of the tariff implementation.
For the Dollar Index, the 97.90 and 99.10 levels will be key. If the downtrend breaks, the ongoing gradual decline of the dollar may pause, allowing for a limited rebound. However, a drop below 97.90 could trigger another leg down, similar to previous moves.
A side note on inflation:
Sometimes, year-on-year figures alone are not enough to provide a clear picture due to base effects. Starting this month, the base effect turns positive for yearly comparisons.
If inflation is to return to the 2% target steadily, month-on-month inflation needs to remain at or below 0.2%. For example, twelve consecutive months of 0.2% monthly inflation results in a 2.22% annual CPI. In contrast, twelve straight months of 0.3% monthly inflation would lead to a 3.35% annual rate.


Possibility of uptrend It is expected that after some fluctuation and correction in the support area, a trend change will take place and we will witness the start of an upward trend. A break of the green resistance area will be a confirmation of the upward trend. Otherwise, the continuation of the corrective trend to the support areas will be possible.


DXY's pullback is dueThe USD has been very weak, which means that a pullback is due. I won't be participating in shorting the USD this coming week despite the Fundamentals have been telling us. Seeing through the technical point of view, we 've seen that May's low had been purged last week. Price action is anticipated to make its way buyside. The full-bodied Daily bearish candle to the left at 100.500 is going to be the magnet for price to seek into mitigate next week.

US Dollar Analysis - by MMFX This is not a prediction, it never is.
My bullish anticipation on the instrument is rooted from many catalyst of course, though the proof of the pudding is communicated on the charts itself.
I zero in on the Weekly to Day bias on price action looking for: Market Structure, Inducement, CISD, Candle Stick Patterns, Voids/Gaps, SMT, Liquidity Sweeps, Bullish ChoCH, BOS, etc.
On the 4H - 30M scope i look to refine and define the narrative.
Monitoring fundamentals & lending rates on the global and domestic scale I pair this with
barometers related to the index such as Treasury's, GOLD and other securities to identify if my Bullish suspicions are true..
Thank you.


Highly likely the DXY goes down.Trading the DXY increase in 2022 was my best trade of that year. Specifically on the USD/CAD pair not the whole index. Options worked great for this.
I had call options on USX not the company. It's Options on the US Dollar (USX) on the TMX exchange in Montreal Canada. To gain exposure to a rising dollar, or to hedge existing positions, call options on USX can be an effective tool. If DXY is going down like 2020-2021 it's great for stocks and equities. A falling dollar is also beneficial from the perspective of US national debt, as it makes interest payments cheaper in relative terms. Also many people outside the US have USD debts so example they make CAD but their debts are in USD. Well now their company is worth more as debt went down and revenue up. Otherwise known as currency risk. Very important for companies dealing in multiple currencies regardless of the type of business they do.
The US has incentive for a weaker dollar as the interest payments on their debt are now around $1 Trillion a year.
This yellow line represents a significant long-term resistance level. As long as the price fails to break and hold above this zone, the path of least resistance remains to the downside.
The MACD is currently moving down, supporting a bearish bias. However, there are two key bullish signals I am watching that would challenge this view:
The Bullish Crossover: This occurs if the blue MACD line crosses above the orange signal line.
On the daily timeframe, a simple crossover can sometimes be a temporary fake-out (like
the "flip-flopping" seen around April 3rd-9th). While it's a warning, it's not always a
definitive trend changer on its own.
The Bullish Divergence: This is the more powerful signal. If the price has set a new low since
April 2025 but the MACD has formed a higher low, it creates a bullish divergence. A
confirmation of this pattern could signal the end of the long-term downtrend and mark a
serious change in market conditions.
A bullish crossover happening at the same time as a confirmed bullish divergence would be a very strong combination, making a short position on the DXY extremely risky.
**Disclaimer:**
*The information provided in this post is for educational and informational purposes only. It does not constitute financial advice, investment recommendations, or a solicitation to buy or sell any financial instruments. All investments involve risk, and the past performance of a security, market, or trading strategy does not guarantee future results. I am not a financial advisor. Please conduct your own thorough research and consult with a qualified financial professional before making any investment decisions. You are solely responsible for any investment decisions you make.*

