DXY QUITE BEARISH ON WEEKLY DXY might just drop to previous low of May 2021 at the 89 if this weekly downtrend continues
US Dollar Index Futures
97.52USDR
+0.29+0.30%
At close at Jul 11, 20:58 GMT
USD
No trades
DOLLARINDEX trade ideas


DXY Risk Reversal Blueprint: Monthly Chart Analysis
The DXY is currently 6.5% above the midpoint of a critical confluence zone ("the box") on the monthly chart, where multiple trendlines and a key 50%/61.8% Fibonacci retracement level align to form a powerful support/resistance area. The monthly timeframe amplifies this zone’s strength, with price repeatedly respecting these trendlines (marked with arrows), confirming their reliability. The recent large retracement in the DXY signals a potential major move as it approaches this mega support. In 2017 and 2020, the DXY entered the box, consolidated for ~300 days, and then reclaimed higher, resuming an upward trend. I expect a similar pattern this time: a 6.5% drop to the box’s midpoint (aligned with the 50%/61.8% Fib zone), followed by ~300 days of consolidation and an upside breakout, potentially signaling a market top for risk assets. This high-conviction setup serves as a blueprint to de-risk and guide portfolio decisions, such as trimming or adding to positions in stocks and crypto. Given the DXY’s inverse correlation with risk assets, a move into the box could favor accumulating risk asset positions, while an upside reclamation could prompt trimming to reduce exposure. Once the DXY nears this mega support, I’ll analyze lower timeframes (e.g., weekly, daily) for bottoming signals to confirm the reversal. Monitoring price action, volume, and candlestick patterns near the box is crucial for precise timing.
#DXY #TechnicalAnalysis #Fibonacci #Stocks #Crypto #HighConviction


This look promising for Crypto!The DXY breaking below its trend channel is a really positive sign for risk assets like Bitcoin and Altcoins. Usually, a weak dollar means more money flows into risk assets. The DXY's technical target is 89, which is the level to watch for the end of the crypto bull run.


Forex Weekly Round-Up - 30th Jun 25Dollar Index:
Dollar Index declined further, hovering near 97.0–96.9 — its weakest level since February 2022.
Key Driver: Markets digested a slightly hotter US core PCE inflation report (+2.3% YoY for May), paired with weak personal spending, reinforcing expectations that the Federal Reserve might pivot to rate cuts later this year.
GBPUSD:
The pound surged, touching highs around 1.3770 — its strongest in nearly four years — before dipping slightly to finish the week near 1.3720
Weekly gain clocked in around +2%, the largest move since early March
Rally Fuelled By : Broader dollar weakness, easing Middle East tensions (ceasefire), and dovish Fed signals suggesting potential rate cuts.
EURUSD
The euro enjoyed a rally, peaking near 1.1754 — its highest since September 2021 — before closing the week around 1.1720
Weekly gain came to approximately +1.7% to +1.9%, driven by euro strength and broad weakness in the US dollar
Traders are eyeing upcoming US data (PCE inflation, Michigan sentiment) for next directional cues
------------------------------------
I will be approaching the markets differently from now on.
Based on the feedback from past analysis, I will be compiling all related pairs into one video, giving you guys the ability to see how one asset affects the other.
This is called inter-market relationship and it's something i've been doing for years.
It gives you confidence on what pairs are 'Hot Picks' and the ones that have a high chance of not delivering the way you want.

DXY Outlook: Mild Bearish Movement Anticipated 4hrThe DXY (US Dollar Index) appears to be entering a mild bearish phase, with a potential move down from the 97.721 level. Based on current momentum and technical indicators, it is likely to approach key support zones between 96.22 and 96.00, where a bullish reversal could potentially occur.
However, there is a reasonable chance the market could extend its decline beyond these levels, possibly reaching as low as 95.404 before finding a more stable support base.

DXY 4hour TF - June 29th, 2025DXY 6/29/25
DXY Bearish Idea
All significant timeframes (monthly,weekly,daily 4hr) appear bearish for now.
Last week on June 25th, 2025 we saw price action break through our 98.000 zone confirming more bearish movement. This week we have two likely options that we will wait for confirmation on.
Bearish Continuation - Ideally we keep with the trend and look for lower highs below 98.000 for further confirmation. If we can spot rejection from this zone it is likely we will see DXY continue bearish for the week ahead.
Reversal - This is less likely but still possible. Price action could punch back through the 98.000 resistance and begin retesting previous highs. If this happens look for candlestick confirmation above 98.000 and expect a more bullish DXY for the week ahead.

Dollar Index DXY AnalysisSince the start of 2025, the US Dollar index DXY has faced a downside pressure driven by several key factors:
* Ongoing uncertainty around the US President trade tensions with major economies.
* Global Central banks reducing dollar exposure and reallocation toward other currencies and Gold.
* Growing market expectations for Fed rate cuts starting Sept-25.
* Raising concerns regarding US Debt levels, amplified recently by the "Big Beautiful Bill"
* Renewed clashes between Trump & Powell, raising concerns regarding the Feds credibility.
With all the factors above affecting DXY negatively, we have key major areas to keep our eye on:
* Breaking below the 96.5 we could visit the 95.5, and with additional sellers' momentum we could see the next level of 93.5
* On the other hand, if we have economic data supporting dollar strength. Breaking above 97.7 our next target could be 98.5, and with additional buyers' momentum we could revisit the 100-level flat.
Disclaimer: easyMarkets Account on TradingView allows you to combine easyMarkets industry leading conditions, regulated trading and tight fixed spreads with TradingView's powerful social network for traders, advanced charting and analytics. Access no slippage on limit orders, tight fixed spreads, negative balance protection, no hidden fees or commission, and seamless integration.
Any opinions, news, research, analyses, prices, other information, or links to third-party sites contained on this website are provided on an "as-is" basis, are intended only to be informative, is not an advice nor a recommendation, nor research, or a record of our trading prices, or an offer of, or solicitation for a transaction in any financial instrument and thus should not be treated as such. The information provided does not involve any specific investment objectives, financial situation and needs of any specific person who may receive it. Please be aware, that past performance is not a reliable indicator of future performance and/or results. Past Performance or Forward-looking scenarios based upon the reasonable beliefs of the third-party provider are not a guarantee of future performance. Actual results may differ materially from those anticipated in forward-looking or past performance statements. easyMarkets makes no representation or warranty and assumes no liability as to the accuracy or completeness of the information provided, nor any loss arising from any investment based on a recommendation, forecast or any information supplied by any third-party.

Skeptic | Weekly Watchlist : DXY Triggers & Pro SetupsLast week, DXY played out our bearish scenario perfectly, breaking the short trigger at 98.530 and delivering a strong downward move . With Higher Wave Cycle (HWC) and Minor Wave Cycle (MWC) now bearish, I’m leaning heavier on short positions with tighter risk management. Let’s break it down with no FOMO, no hype, just reason. 📊
Daily Timeframe: The Big Picture
The key support at 98.801 was decisively broken, and we’ve confirmed below it—the major trend is now fully bearish. The next daily support lies at 96.478 , but I expect range-bound action early this week, especially after last week’s big move. Patience is key—let the market form a clear structure before jumping back in.
Key Insight: The bearish trend is locked in, but early-week consolidation is likely. Wait for the market to signal its next move.
4-Hour Timeframe: Long & Short Triggers
Zooming into the 4-hour chart, let’s pinpoint Low Wave Cycle (LWC) and triggers for long and short setups:
Short Trigger: Break below 4-hour support at 96.995 , confirmed by RSI re-entering oversold. Want to wield RSI like a pro? Check out my RSI Masterclass —it’s a game-changer! 😏
Long Trigger: Break above resistance at 98.215 . This is riskier since it’s against the bearish trend—set a wider stop-loss and take profits quickly. Why? HWC and MWC are bearish, so the first uptrend wave risks stop-loss hunts or fakeouts. I’ll drop an HWC/MWC/LWC guide soon to optimize entries, stops, and more—stay tuned!
Pro Tip: For longs, expect volatility in the first wave. Shorts align with the trend, so they’re the safer play—focus on 96.995.
Final Vibe Check
This Weekly Watchlist sets you up to trade smarter, not harder. DXY’s bearish momentum is our focus, but patience will unlock the best setups. I’ll keep you updated daily as markets evolve. Protect your capital—max 1%–2% risk per trade, no exceptions. Want the HWC/MWC/LWC guide or another pair? Drop it in the comments! If this watchlist sharpened your edge, hit that boost—it fuels my mission! 😊 Stay disciplined, fam! ✌️
💬 Let’s Talk!
Which setup are you eyeing this week? Share in the comments, and let’s crush it together!

“The Dollar Job: Break-In Strategy for 99+ Profits”💸 “DXY Heist Blueprint: Thieves’ Bullish Breakout Play” 🏴☠️
🌟Hi! Hola! Ola! Bonjour! Hallo! Marhaba!🌟
Welcome, Money Makers & Silent Robbers 🕶️💼✨
This is our next big Thief Trading Heist Plan targeting the 💵 DXY Dollar Index Vault. Armed with both technical precision 🔍 and fundamental insight 📊, we're ready to strike smart — not just fast.
🎯 THE MASTER HEIST PLAN:
🟢 ENTRY POINT – “Heist Entry Protocol”
🎯 Wait for price to break above Resistance @ 99.000 and candle to close ✅
💥 Plan A: Place Buy Stop Orders just above breakout
📥 Plan B: For Pullback Pros, use Buy Limit at recent swing low/high (15m–30m TF)
📌 Tip: Set alerts — don’t get caught napping while the vault opens! ⏰🔔
🛑 STOP LOSS – “Thief’s Escape Hatch”
🧠 Use 4H swing low at 98.100 as SL
⚖️ Adjust based on your lot size and number of open positions
🚨 Don't rush to set SL for Buy Stop entries before confirmation! Patience is part of the plan. 😎
🎯 TARGET – “Mission Objective”
💰 First Exit Target: 100.000
🏃♂️ Optional: Escape earlier near high-risk zones (Blue MA Line Trap Area)
⚔️ SCALPERS' CODE – Stay Sharp!
Only scalp on the Long side.
🔐 Use Trailing SL to guard your loot!
💸 Big wallets? Jump early.
🧠 Smaller stack? Follow the swing crew for coordinated execution.
🌐 MARKET OUTLOOK: WHY THE VAULT’S OPENING
💡 Currently seeing bullish momentum in the DXY
📈 Driven by macroeconomics, sentiment shifts, and intermarket pressure
📰 Want the full debrief? Check our analysis across:
COT Data
Geopolitics & News
Macro Trends & Sentiment
Fundamental Forces
📎🔗 See full breakdown
⚠️ TRADE MANAGEMENT ALERT
🚫 Avoid opening new trades during high-impact news
🔁 Always use Trailing Stops to lock in profits
❤️ Support The Heist – Boost the Plan!
Every boost powers our underground crew 🐱👤.
We rob the markets, not the people. 💼💰
Like & Boost to help grow the Thief Trading Gang 👊💥
Stay tuned, robbers – more heist plans dropping soon.
💸🚀📈🤑

DXY Weekly ForecastDXY Weekly Forecast
- Go for up move if setup given
A Message To Traders:
I’ll be sharing high-quality trade setups for a period time. No bullshit, no fluff, no complicated nonsense — just real, actionable forecast the algorithm is executing. If you’re struggling with trading and desperate for better results, follow my posts closely.
Check out my previously posted setups and forecasts — you’ll be amazed by the high accuracy of the results.
"I Found the Code. I Trust the Algo. Believe Me, That’s It."


USDX-BUY strategy 6 hourly chart Reg. ChannelThe index is near the bottom of the channel and indicators are positive.
It worthwhile to look at this carefully, as it will help us in deciding on the other pairs. The current support is a bit lower than the close 97.26 and we can expect 98.30-98.60 area as our objective.
Strategy BUY @ 97.00-97.40 and take profit near 98.50.

DXY: The Market Is Looking Down! Short!
My dear friends,
Today we will analyse DXY together☺️
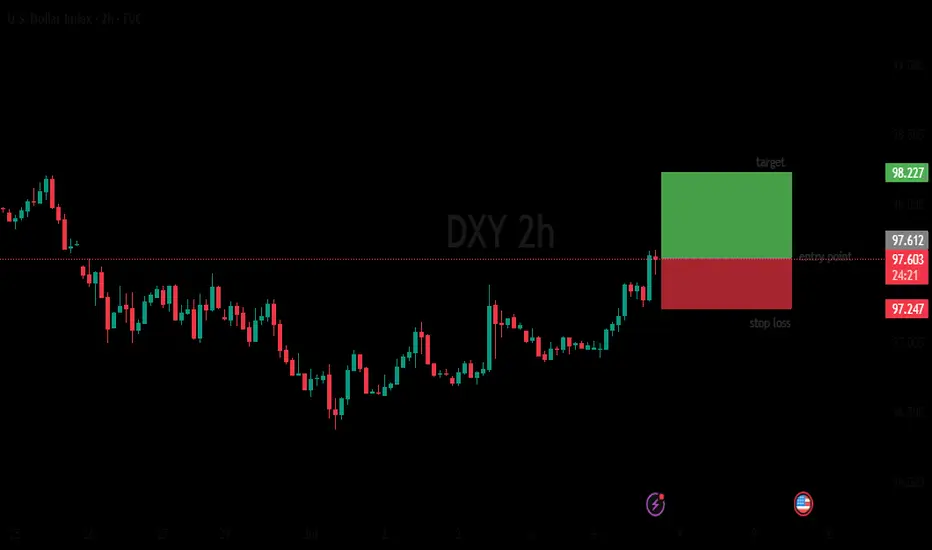
The in-trend continuation seems likely as the current long-term trend appears to be strong, and price is holding above a key level of 97.370 So a bullish continuation seems plausible, targeting the next high. We should enter on confirmation, and place a stop-loss beyond the recent swing level.
❤️Sending you lots of Love and Hugs❤️

DXY Bearish Bias
Institutions are currently holding a net short position on the Dollar, indicating bearish sentiment. With a net position of -4,282, we may expect continued weakness in the DXY, especially if price reacts from key supply zones. Swing traders should remain cautious with long setups and prioritize opportunities aligned with USD weakness across major pairs.

Bold analysis for the most powerful currency in the world (DXY)Orange range: entering in several steps .
Green area: important support and exit point .
Important note: The gray line is the liquidity range
Watch the dance around this line carefully (bank positions are settled around this line)
And in my opinion, by increasing the price, they are emptying it on the buyers, so buy cautiously, but sell boldly.
GL

Dollar Index Analysis [DXY]Market has show upper wicks for last 3 days which is the sign that there is still sell pressure. The daily candles for this week are range bound. 4H chart is showing short term uptrend which is maintaining higher highs and higher lows. We can use this range to have scalps in this range.

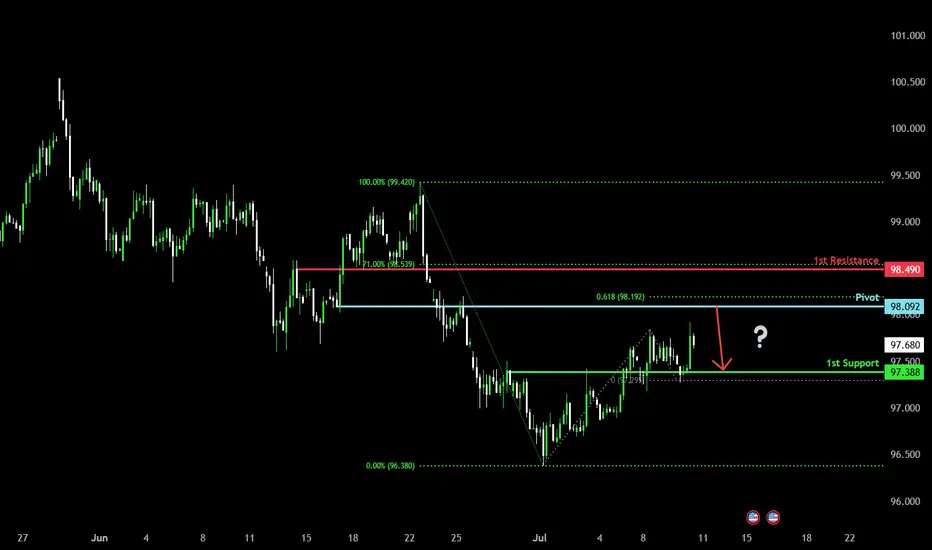
Could the price reverse from here?US Dollar Index (DXY) is rising towards the pivot and could reverse to the 1st support which acts as an overlap support.
Pivot: 98.09
1st Support: 97.38
1st Resistance: 98.49
Risk Warning:
Trading Forex and CFDs carries a high level of risk to your capital and you should only trade with money you can afford to lose. Trading Forex and CFDs may not be suitable for all investors, so please ensure that you fully understand the risks involved and seek independent advice if necessary.
Disclaimer:
The above opinions given constitute general market commentary, and do not constitute the opinion or advice of IC Markets or any form of personal or investment advice.
Any opinions, news, research, analyses, prices, other information, or links to third-party sites contained on this website are provided on an "as-is" basis, are intended only to be informative, is not an advice nor a recommendation, nor research, or a record of our trading prices, or an offer of, or solicitation for a transaction in any financial instrument and thus should not be treated as such. The information provided does not involve any specific investment objectives, financial situation and needs of any specific person who may receive it. Please be aware, that past performance is not a reliable indicator of future performance and/or results. Past Performance or Forward-looking scenarios based upon the reasonable beliefs of the third-party provider are not a guarantee of future performance. Actual results may differ materially from those anticipated in forward-looking or past performance statements. IC Markets makes no representation or warranty and assumes no liability as to the accuracy or completeness of the information provided, nor any loss arising from any investment based on a recommendation, forecast or any information supplied by any third-party.
DXY Bearish Setup
Entry: 97.50 (current price)
Target (TP): 96.500 or below
Stop Loss (SL): ~97.80 (above recent swing high or resistance)
Risk Management: Essential — position size based on SL distance and account size
🔍 Trade Rationale:
Technical View: Price may be forming a lower high, suggesting possible downside continuation.
Fundamental Pressure:
Market cautious on Fed rate path
Tariff uncertainty could weaken USD
Upcoming FOMC minutes may add pressure if dovish signals emerge

Bullish for DXY, tuesday trading still bullish on dxy, two areas of interest are those two 4hr fvg shown. Thier is also sellside liquidity , whcih we can sweep or we can have a deeper retracement, and touch the second fvg. I am still expecting a bullish dollar for the week, even tho my weekly objective has been met. The US10Y looks really strong and the u.s trasury bonds look week. The only thing is that if you look at the eurusd chart, we have equal highs, so that can be something to watch.