Bears still are hereWhen we were talking about the negative financial consequences of tariffs and protectionism, the markets were declining — you can check our previous forecasts, we were right.
After that, the markets started to recover from the bear market — it's unclear why, since volatility and Trump’s reckless policies persist.
The coming years, we’re all going to be spending time with the bears. "Buy the dip" and "buy and hold" strategies are, to put it mildly, not the best options this year or next.
Get ready for the next recession.
US Tech 100 - Cash
21,728.49USDR
−133.00−0.61%
As of today at 11:55 GMT
USD
No trades
US100 trade ideas

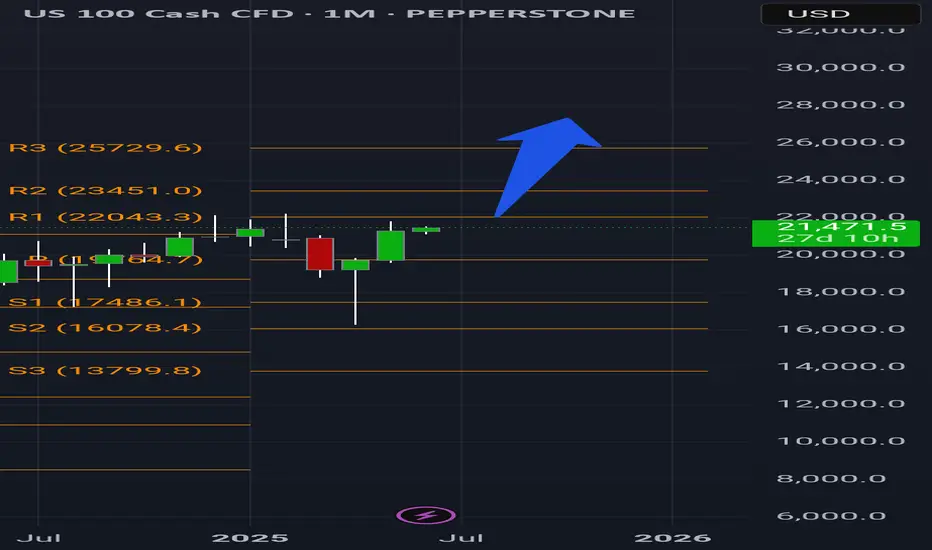
Nas100 Monthly textbook Bullish reversalWe've printed a classic bullish reversal. The higher the timeframe the more weight I give to formations.
I believe we are in for a massive exponential move. Works together with my past diamond bottom analysis which safely got us to here.
Risk and reward is yours. This chart tells me to be buying and I am, win or lose 😤 play safe.
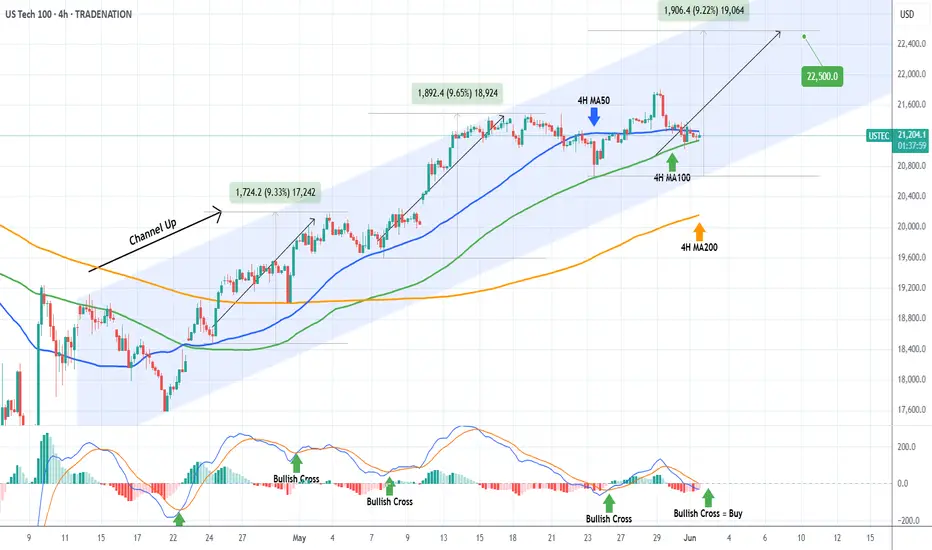
NASDAQ Will the 4H MA100 come to the rescue?Nasdaq (NDX) is trading within a 3-week Channel Up, which is currently supported by the 4H MA100 (green trend-line). In fact, the price is being squeezed in the last three 4H candles within the 4H MA100 and the 4H MA50 (blue trend-line).
This tight compression technically tends to cause violent break-outs either way. As long as the Channel Up holds, we expect that to be upwards and it should be confirmed by the formation of a 4H MACD Bullish Cross.
With the last two major rallies being around +9.50%, we expect to see 22500 on the next Leg Up.
-------------------------------------------------------------------------------
** Please LIKE 👍, FOLLOW ✅, SHARE 🙌 and COMMENT ✍ if you enjoy this idea! Also share your ideas and charts in the comments section below! This is best way to keep it relevant, support us, keep the content here free and allow the idea to reach as many people as possible. **
-------------------------------------------------------------------------------
Disclosure: I am part of Trade Nation's Influencer program and receive a monthly fee for using their TradingView charts in my analysis.
💸💸💸💸💸💸
👇 👇 👇 👇 👇 👇
US100 - Bullish Momentum Favors Upside ContinuationThe US Tech 100 is displaying strong bullish momentum after successfully breaking above the critical resistance level at 20,659.8, which had previously acted as a significant barrier. Currently trading at 21,316 the index has demonstrated impressive upward trajectory following what appears to be a healthy consolidation phase around the key resistance-turned-support zone. The technical setup strongly favors continuation to the upside as the higher probability scenario, with the breakout above 20,659.8 potentially opening the door for further gains toward higher resistance levels. However, prudent risk management suggests taking this rally piece by piece, monitoring how price action develops at each significant level while watching for any signs of exhaustion or pullback that might offer better entry opportunities. The bullish bias remains intact as long as the index maintains its position above the former resistance level, which should now serve as dynamic support for any potential retracements.
Disclosure: I am part of Trade Nation's Influencer program and receive a monthly fee for using their TradingView charts in my analysis.

Recession post #9778Trial and error describes my past calls considering there was resistance and pullbacks on the daily tf but this time I'm certain
abso-tut-ely
Posi-tively
Demise
Trumps attempts have played out like a witty protagonist of a finance suspense thriller but that has nothing to do with the historical alignments of boom and bust systems. I think he intended to crash markets so it could recover but I'm not convinced this tank is greater than this

Hanzo / Nas100 15 Min Path ( Tactical Break Out Zones )🔥 Nas100 – 15 Min Scalping Analysis (Bearish Setup)
Bias: Waiting For Break Out
Time Frame: 15 Min
Entry Type: Confirmed Entry After Break Out
👌Bullish After Break : 21740
Price must break liquidity with high volume to confirm the move.
👌Bearish After Break : 21675
Price must break liquidity with high volume to confirm the move.
☄️ Hanzo Protocol: Dual-Direction Entry Intel
➕ Zone Activated: Strategic Reaction from Refined Liquidity Layer
Marked volatility from a high-precision supply/demand zone. System detects potential for both long and short operations.
🩸 Momentum Signature Detected:
Displacement candle confirms directional intent — AI pattern scan active.
— If upward: Bullish momentum burst.
— If downward: Aggressive bearish rejection.


"NASDAQ 100: THE TECH ROBBERY! – Quick Profits Before Reversal?"🔥 "The NDX NASDAQ 100 INDEX Heist: Bullish Loot & Escape Before the Trap!" 🔥
🌟 Hi! Hola! Ola! Bonjour! Hallo! Marhaba! 🌟
Dear Money Makers & Market Robbers, 🤑💰💸✈️
Based on the 🔥Thief Trading Style🔥 (technical + fundamental analysis), here’s our master plan to heist the NDX - NASDAQ 100 INDEX. Follow the strategy on the chart—long entry is the play! Aim to escape near the high-risk RED Zone (overbought, consolidation, potential reversal). The bears are lurking, so take profits and treat yourself—you’ve earned it! 💪🏆🎉
🚀Entry (The Vault is Open!)
"Swipe the bullish loot at any price!"
For precision, place buy limit orders within 15-30min timeframe (recent swing lows/highs).
Set alerts! Don’t miss the heist.
🛑 Stop Loss (Safety Net)
Thief-style SL at nearest swing low (4H timeframe) → 21,000.00 (adjust based on risk/lot size).
🏴☠️ Target 🎯: 22,800.00
Bullish momentum is fueling this heist—ride the wave but exit before the trap!
📰 Fundamental Backing (Why This Heist Works)
Macroeconomic trends, COT data, geopolitics, and sentiment align for bullish moves.
Full analysis? Check our bio0 linkk! 👉🔗🌎
⚠️ Trading Alerts (News & Risk Mgmt)
Avoid new trades during high-impact news (volatility = danger).
Use trailing stops to lock profits and dodge sudden reversals.
💥 Boost This Heist!
Hit 👍 (Boost Button) to strengthen our robbery squad!
More heists = More profits—stay tuned for the next steal! 🚀🤑
See you soon, fellow thieves! 🤝🎉

Nas100 1. Determine the Higher Timeframe Bias
Look at Daily & 4H charts.
Identify: Is market forming higher highs/lows (bullish) or lower highs/lows (bearish)?
2. Mark Liquidity Pools
Find equal highs/lows – where smart money will draw price to.
These often act as targets.
3. Find Displacement & Fair Value Gaps
If price made a strong move away from a level (displacement), look for a FVG on 1H/4H/Daily to see if price might retrace before continuing.
4. Use Premium/Discount Tool
From the recent swing high to low (or vice versa), divide the range.
Price in discount = buy zone; in premium = sell zone.
5. Mark Key Session Times
Focus on New York Open (8:30–11:00 am EST) – high-probability moves.

US100 – Short Setup Active After Rejection from Resistance ZoneThe US100 on the 30-min chart is showing signs of bearish rejection near the 21,550 resistance zone after a sharp intraday rally. Price has failed to hold above the Ichimoku cloud and is now entering a short bias setup, targeting the lower support area.
🔹 Technical Context:
Rejection at resistance (21,550)
Bearish candle forming below cloud top
Intraday downtrend potential toward 21,200 – 21,180
🔹 Trade Idea:
Entry Zone: ~21,445
Target: 21,200 – 21,180
Invalidation: Above 21,560
Momentum is weakening, and a breakdown may trigger further downside. Short trade active with risk-managed levels. 📉🧭
Note : If you found this helpful, like and follow for more trade ideas!
Share My Idea With Your Firends Mention Your Feed back Comment Section
This is not financial advice. Please conduct your own research and manage risk accordingly.

NAS100...Ever The Bullish Instrument...Part 38The last ATH was signaled on February 25, 2025 at exactly 3:00 am EST...(Back Test and see the M1 chart)
Since that time the market has started to make LH's LL on the smaller timeframes in order to create the next HL on the largest active timeframe.
For almost 2 months, the market entered into a deep and hard retracement with many doomsday fanatics aiming at becoming the next phenomenon in trading predictions, trying to suggest that this is the beginning of the greatest drop the NAS100 and other instruments will ever see.
I have always maintained and I stand even more firmly on the fact that any sells you see in the markets are only temporary retracements toward another HL and that the market has always and will only make HL's to HH's.
Fast forward to April 6, 2025 at 7:10 (Back Test and see the M1 chart) pm the market hit it's largest HL point. Since that time...the market has started to make HL's to HH's on your small to medium timeframes while still keeping the largest HL created on the monthly intact.
The H4 time frame you will see is now signaling the first round of HL's to HH's a solid confirmation that the market is finally breaking out of it's retracement phase and back to resume it's usual trend.
Another key factor to note is that last weeks highest point is only approximately 4,000 pips from the ATH and if you have been tracking the NAS100 you should have noticed that every week that number is getting smaller and smaller and it will only be a matter of time for that to be broken again.
With that being said, my strategy still remains the same...
1. Enter on my largest HL and trade to my HH's
2. In the event that there is still consolidation in the markets with LH's being created on the
medium timeframes, I simply TP and wait for another setup.
Even with Friday's frenzy created by emotional traders reacting Trump and his circus show, the markets still held their own and still closed above the low of every single week since April 6, 2025.
What this means is that the ATH will be broken very soon and it just requires patience and a dedication to the strategy to ensure that it is followed to the last detail.
I say without apology...
All highs on the NAS100 are guaranteed to be broken
The NAS100 trades only HL's to HH's and that is a guaranteed fact
So trade wisely...
Trade smartly...
Manage your risk...
Happy Trading...
#oneauberstrategy
#aubersystem
#whywewait
#patience
#zigzagtheory

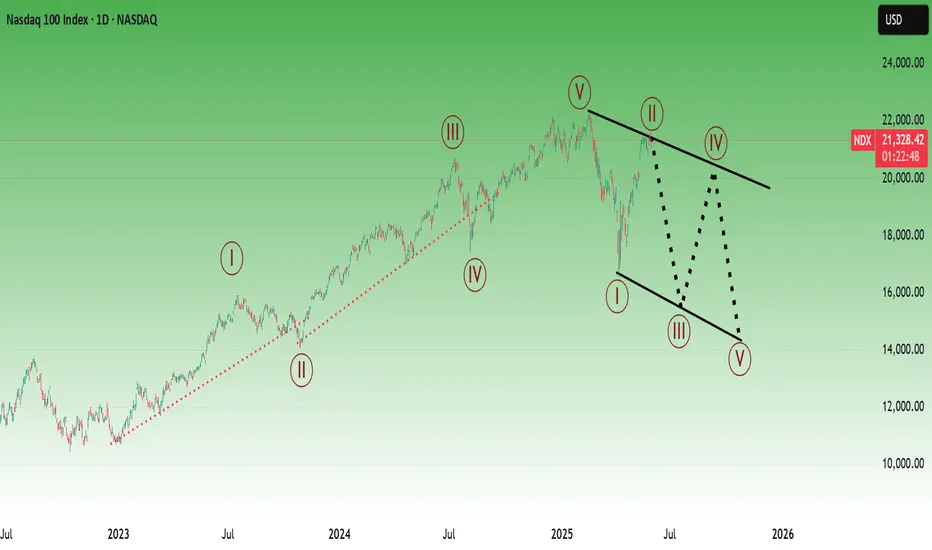
NAS100 - Potential Targets [SHORT]Dear Friends in Trading,
How I see it:
Nasdaq is currently within a key Supply Zone.
There is a little more liquidity above 21800 that could potentially be swept.
Should this previous key Supply Zone offer enough selling pressure, and or profit taking,
price can be forced to fill buy side gaps at long last.
SHORT Threshold = 20755 - 20617
Potential Gap Targets: "SHORT"
1] 20200
2] 18400
I sincerely hope my point of view offers you valued insight.
Thank you for taking the time to study my analysis.

NAS100 - Massive Rejection at Supply Zone! Bearish Setup BrewingPrice has tapped into a clear Supply Zone and is showing signs of distribution.
Bearish divergence forming across momentum indicators (not shown here).
Price has failed to break new highs = Possible double top structure forming.
Arrows indicate potential downside targets if rejection holds.
---
💡 Trade Idea:
🎯 Sell Setup: Look for confirmation (e.g., break of short-term support or bearish engulfing) to target 19,185 → 16,948
❌ Invalidate if price breaks and closes above 21,785 with volume
---
📢 What do you think? Is NAS100 ready to drop? 💬 Drop your thoughts in the comments. 👍 Like & 🔁 Share if you find this helpful! 📈 Follow for more high-probability setups weekly.
#NAS100 #US100 #NASDAQ #TradingView #SupplyAndDemand #PriceAction #ForexSignals #BearishSetup #MarketAnalysis #SwingTrading #DayTrading #SmartMoney

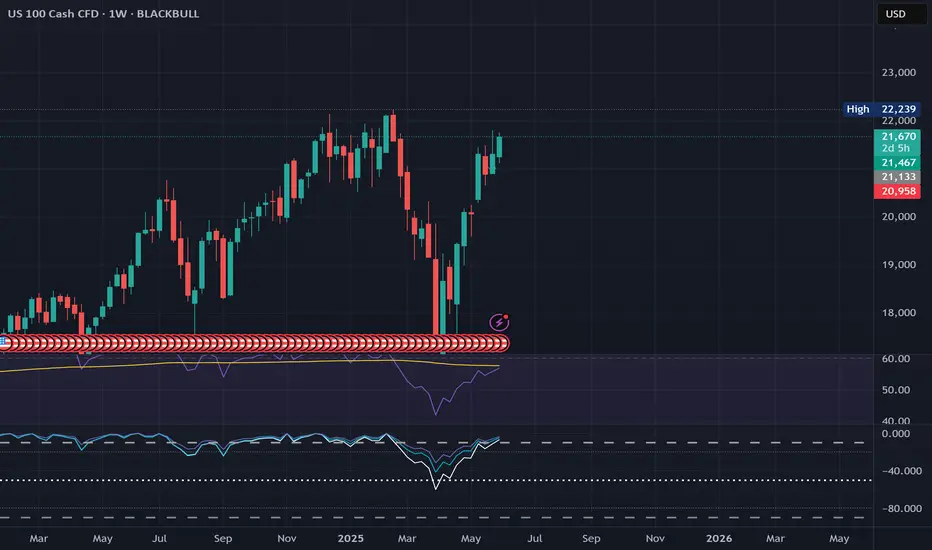
Staircase seen in real chartsFor the most part OANDA:NAS100USD has exhibited a near perfect staircase up so far.
It does appear fairly extended right now, but with rotation out of safe havens into risk on assets again, what remains to be seen is how much fuel is in the tank, and how far can the tailwind take it.

Can Tech Strength Still Drive Markets Amid Trade Tensions?Macro approach:
The Nasdaq 100 (USTEC) began Jun with strong momentum after its best monthly performance since 2023, fueled by robust tech earnings and a brief lull in tariff concerns.
- However, renewed US-China trade tensions resurfaced early in the week, briefly weighing on sentiment before a market rebound restored cautious optimism.
- Nvidia (NVDA) surged due to the continued demand for AI chips. At the same time, Tesla (TSLA) drew investor focus ahead of its 12 Jun robotaxi launch, helping maintain positive momentum in the face of geopolitical uncertainty.
Technical approach:
- USTEC is now testing the previous swing high near 218000, staying above both EMAs, a sign of ongoing bullish strength.
- A clear break above 21800 would likely open the path toward the record-high zone near 22200.
- Failure to do so may trigger a pullback toward the nearest support of around 20700.
Analysis by: Dat Tong, Senior Financial Markets Strategist at Exness


NASDAQ Outlook: Waiting for a Catalyst in a Range-Bound Market!The NASDAQ NAS100 has shown impressive gains recently 📈, but overall sentiment remains cautious 😐 as the market consolidates and trades sideways in the short term 🔄. Investors seem to be waiting for a new catalyst—such as major economic data or policy announcements 📰—before committing to a clear direction.
Ongoing political and economic uncertainties, including trade negotiations 🤝, interest rate outlooks 💸, and valuation concerns 💰, are keeping market participants on edge. Given these factors, the near-term environment is likely to remain choppy and range-bound 🌊. As traders, it’s important to approach the markets with caution ⚠️, especially as equities approach key resistance areas 🚧. This uncertainty may also impact currency and other financial markets 💱. While tech stocks could eventually break out of the current range 💻, the direction is still unclear. Prioritize risk management and protect your capital during this period of heightened uncertainty 🛡️.
Political and economic uncertainties—like ongoing trade negotiations, interest rate expectations, and concerns about valuations—are keeping investors on edge.
The near-term outlook for the US100 is for choppy, range-bound trading as the market works through these uncertainties.