Nasdaq-100 H4 | Approaching an overlap supportThe Nasdaq-100 (NAS100) is falling towards an overlap support and could potentially bounce off this level to climb higher.
Buy entry is at 20,833.76 which is an overlap support that aligns with the 23.6% Fibonacci retracement.
Stop loss is at 20,100.00 which is a level that lies underneath a pullback support and the 38.2% Fibonacci retracement.
Take profit is at 21,763.98 which is a swing-high resistance.
High Risk Investment Warning
Trading Forex/CFDs on margin carries a high level of risk and may not be suitable for all investors. Leverage can work against you.
Stratos Markets Limited (tradu.com ):
CFDs are complex instruments and come with a high risk of losing money rapidly due to leverage. 63% of retail investor accounts lose money when trading CFDs with this provider. You should consider whether you understand how CFDs work and whether you can afford to take the high risk of losing your money.
Stratos Europe Ltd (tradu.com ):
CFDs are complex instruments and come with a high risk of losing money rapidly due to leverage. 63% of retail investor accounts lose money when trading CFDs with this provider. You should consider whether you understand how CFDs work and whether you can afford to take the high risk of losing your money.
Stratos Global LLC (tradu.com ):
Losses can exceed deposits.
Please be advised that the information presented on TradingView is provided to Tradu (‘Company’, ‘we’) by a third-party provider (‘TFA Global Pte Ltd’). Please be reminded that you are solely responsible for the trading decisions on your account. There is a very high degree of risk involved in trading. Any information and/or content is intended entirely for research, educational and informational purposes only and does not constitute investment or consultation advice or investment strategy. The information is not tailored to the investment needs of any specific person and therefore does not involve a consideration of any of the investment objectives, financial situation or needs of any viewer that may receive it. Kindly also note that past performance is not a reliable indicator of future results. Actual results may differ materially from those anticipated in forward-looking or past performance statements. We assume no liability as to the accuracy or completeness of any of the information and/or content provided herein and the Company cannot be held responsible for any omission, mistake nor for any loss or damage including without limitation to any loss of profit which may arise from reliance on any information supplied by TFA Global Pte Ltd.
The speaker(s) is neither an employee, agent nor representative of Tradu and is therefore acting independently. The opinions given are their own, constitute general market commentary, and do not constitute the opinion or advice of Tradu or any form of personal or investment advice. Tradu neither endorses nor guarantees offerings of third-party speakers, nor is Tradu responsible for the content, veracity or opinions of third-party speakers, presenters or participants.
US Tech 100 - Cash
21,642.39USDR
−244.87−1.12%
As of today at 12:58 GMT
USD
No trades
US100 trade ideas


Upcoming Monthly/Weekly Analysis!FA Analysis:
1- Recent macro-economic data were good. But they do not reflect the Tariffs impacts.
2- All expected data (i.e., inflation, consumer sentiment) were inline with the projected tariff impacts.
3- Uncertainty is in the driver seat as long as Trump flip flop with his tariffs.
4- The 90-day tariff pause ends by July 4th!!! Surprise...surprise... the liberation day! Definitely, Trump will announce the 2nd Liberation day!
5- From this week and moving forward, data will reflect tariffs impacts.
6- This week, we have many relevant data and probably many Trump tweets.
=) All the above has structural negative impacts on US economy; hence negative impacts on US Stocks and equities.
TA Analysis:
Monthly TF:
NQ monthly close was bullish. From this TF, we should expect a continuation up seeking a new ATH. But I strongly doubt it. The Monthly close was below 21457. If price will be unable to close at least above this level, price should revisit 17236.
In this thread, we do not trade Monthly TF, but it gives us a macro perspective.
Weekly TF:
The weekly close was bearish, even with a green candle. From this TF, we should expect a south move.
In my view, Wave 3 has started last week.
Daily TF:
The chart shows all levels of Wave 3 into 5 mini-waves. The target of this mini-wave 3.1 is the low of May (19594).
Price already broke TL and closed below it. Price from now on it should continue south/down.
Price must close inside the tariff on & off candle (yellow box).
(Note: The chart shows only three waves of 3.1 representing the Initial move, retrace move and impulsive move. But every single move/wave should have 5 waves. I do not represent them to avoid making the chart complex which it's already!).
Hourly TF:
Price might complete the retrace up to 21468-21590. Then resume the down movement as per the chart.
Data will give the ebb and flow to be inline with TA analysis.
That's all for this week/month.
Wish you GL and plenty of green trades.


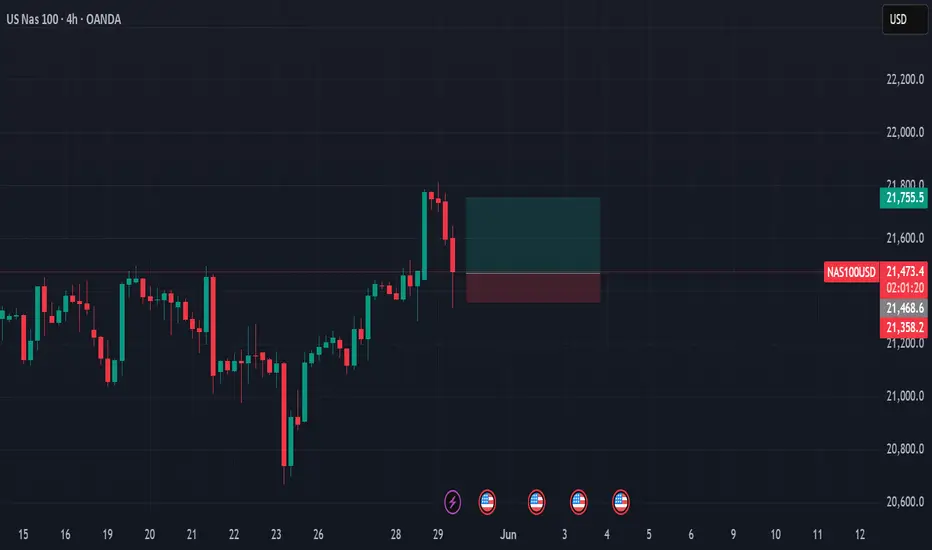
NAS100 4H | Fibonacci Bounce or Break? Key Trendline Test Incomi📈 Description:
Price is currently testing a key ascending trendline on the 4H, sitting just below the 38.2% Fib retracement after rejecting near the 0% level. I’m watching this area closely for either:
✅ A bullish bounce from the 38.2%–50% zone with confluence from EMA 20 and trendline support — targeting 0% then -27% extensions (around 21,750 to 22,200),
or
❌ A clean break and close below the trendline + 61.8% level that could shift short bias toward deeper Fib zones like 78.6% or even 100%.
Indicators Used:
• EMA 20 / EMA 68 for dynamic S/R
• Fibonacci retracement (swing low to recent high)
• Trendline (4H structure support)
🧠 I’ll wait for clear structure before entering — no early entries here. Looking for a strong engulfing candle, MA crossover, or lower-timeframe breakout confirmation depending on the direction.
📍Will update if we get confluence on the 15min/1hr to support entry.

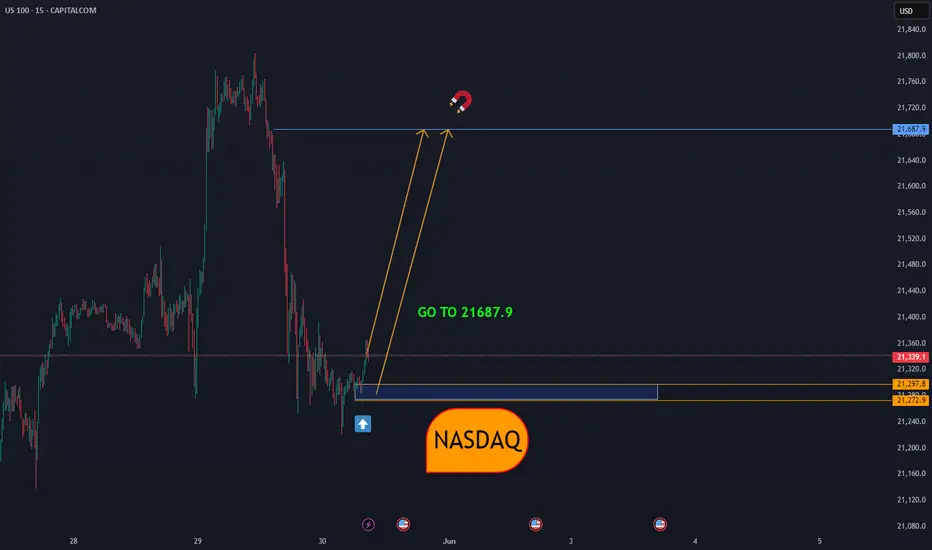
Nas100 w1.trading I deaHi traders as you can see this market is n uptrend market n since Trump come to the office he started tarrif n tarrif cause big rejection as you can see however he paused it n comes bek up,now they were trying to block him but he managed to put them back again because of his reasons,ok cool you have to understand that all this moves since Trump took the office he is the one in charge and he is moving market soo that's why today things can bebetter n tomorrow you can see spike again we we're nearly recession and he paused tarrif,market comes bek up,soo if you stick to the tre you are in the right side,soo note that we are still trading under tarrif territory meaning you can see spike today n tomorrow then drown down that's why you need to be updated 24/7 knowing what is moving and why I laugh when I see someone draw graph n see spike to their direction n immediately get exited within 1 hour market recovery that spike very fast lol,you need to know what is moving the market soo that you wo the surprised soo this year 99% is trump reports that is moving the market if he can imposes tarrif to Europe on 12 June you gonna see entire market going down for short period,tarrif affect the market globally not only were it raised,that's why if trump n China won't make successful deal we might see a recession and as am seeing China they are ready to fight any kind of war and they are loosing interest in trading deals and this will lead to recession globally,all they want is to end tarrif and trump want better deals in businesses aswell soo this is the main n strong trade war between all countries and it can cost people's money,soo according to my analysis am still bullish am not talking this as a retest noo that's why i explained what makes it to fall and positivity to the deals means rally thats why I stick to the trends till now,until further notice,.make sure you are updated.

Make some moneyHere are some more examples….
Like and follow for more - we have 2 indicators you guys can use now!


NSDQ100 INTRADAY at pivotal level ?Tariffs & Trade:
The Trump administration is exploring ways to push through import tariffs, possibly including a temporary 15% tariff for 150 days.
A federal appeals court has paused a suspension of the tariffs for now.
Markets:
US stocks are holding up well. The S&P 500 is on track for its best May since 1990.
However, June may be weaker, and futures suggest a quieter trading day ahead.
Federal Reserve & Tax Concerns:
President Trump urged Fed Chair Jerome Powell to cut interest rates in a recent meeting.
Wall Street is uneasy about a tax measure in Trump’s bill that may increase taxes on foreign investors in US assets.
Europe:
The European Central Bank is expected to cut interest rates next week and again in September, possibly settling at 1.75% until the end of 2026.
Bank of England Governor Andrew Bailey pushed for a stronger EU trade deal and emphasized a slow and cautious approach to rate cuts.
Geopolitics:
Russia hasn’t provided a peace talk agenda to Ukraine or its allies.
Hamas is reviewing a US-backed ceasefire plan but says it doesn’t yet meet its demands.
Key Support and Resistance Levels
Resistance Level 1: 21850
Resistance Level 2: 22050
Resistance Level 3: 22200
Support Level 1: 21000
Support Level 2: 20770
Support Level 3: 20560
This communication is for informational purposes only and should not be viewed as any form of recommendation as to a particular course of action or as investment advice. It is not intended as an offer or solicitation for the purchase or sale of any financial instrument or as an official confirmation of any transaction. Opinions, estimates and assumptions expressed herein are made as of the date of this communication and are subject to change without notice. This communication has been prepared based upon information, including market prices, data and other information, believed to be reliable; however, Trade Nation does not warrant its completeness or accuracy. All market prices and market data contained in or attached to this communication are indicative and subject to change without notice.

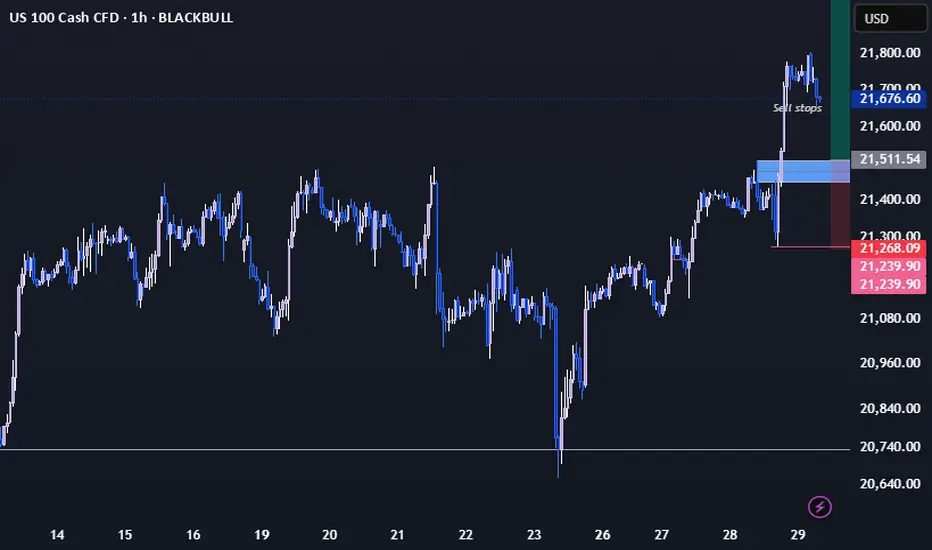
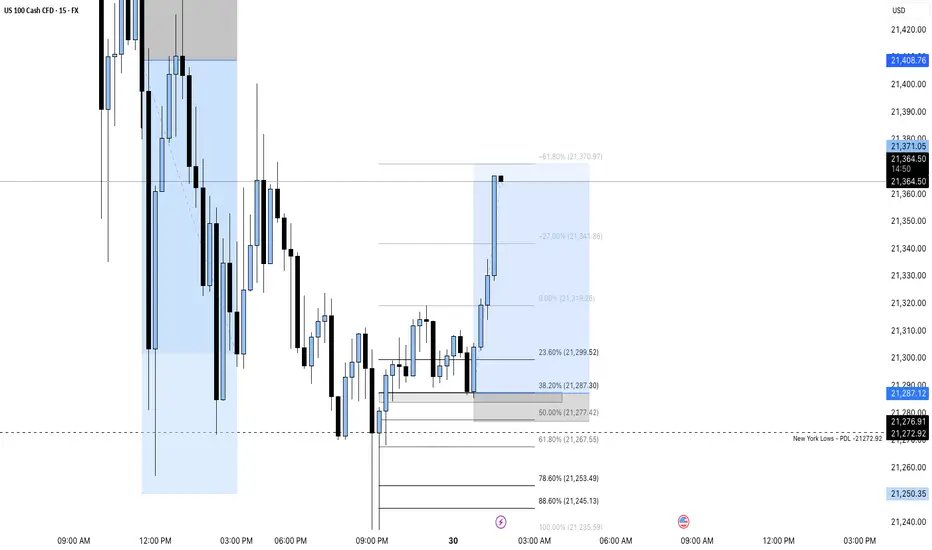
Buy Scalp ideaWe can see that PD NY low swept by Asia and BOS confirmed with London & Asian high break
The Fib on a 15min OB, with confirmation of a bullish engulfing, in the 3-5min time frame we can see a clear demand area that gave a point of liquidity 25% mitigation of 15min OB on red dash line-entry on 61%
Target London High

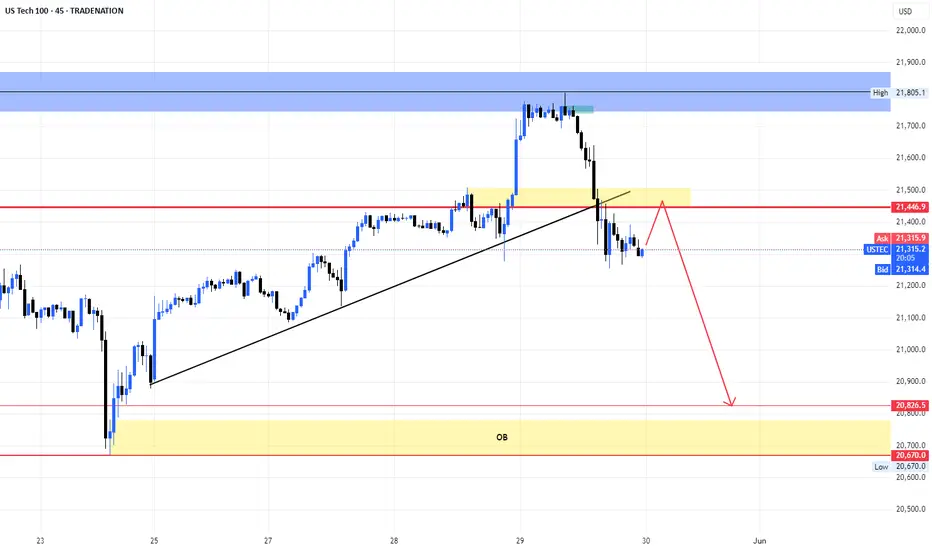
US100 Not yet ready for ATH - Structural BreakdownHere’s a detailed breakdown of the US Tech 100 - NASDAQ on the daily chart and why a lift off to ATHs may not be in play just yet.
✅ Key imbalance zones mapped out
🔻 Expecting downside clean-up before upside continuation
📊 FVGs & inefficiencies stacked below = high-probability revisit zones
If you’re trading NASDAQ, this map could be your cheat sheet before price makes its real move.
The market is respecting the ascending channel, but I’m expecting a cleanup of inefficiencies stacked below before any major continuation. Keep an eye on the key zones marked — price may revisit these areas for liquidity.
📉 Possible short-term correction
📈 Bias still bullish, but not without some pain first
Happy Trading !

NAS100-TEC100 - THE SECRETE OF TRADING INDICES STRATEGYTeam,
yesterday we short the NAS, DOW, DAX and long the GOLD - 4 out of 4 perfectly target hit
Now, we are going long, i want you to carefully look at the picture and understand the concept of how I structure the trade. This has been calculate using my statistic and probability to ensure our entry is safe.
First picture, is buying small volume, if market volatile and push further down, i need you to double up your trade, this allow us to win better.
That's the reason why you saw my videos that everyday i show LIVE trading and profitable every trade. However, always carefully look at your capital and know exactly how much risk are you going to take.
Remember, you can win straight 3-6 months and if you failed risk management and overleverage yourself, the account can easily be kill within 1 day.
Hope you all have a great day.!

Falling towards pullback support?NAS100 is falling towards the support level which is a pullback support that lines up with the 23.6% Fibonacci retracement and could bounce from this level to our take profit.
Entry: 20,809.93
Why we like it:
There is a pullback support level that aligns with the 23.6% Fibonacci retracement.
Stop loss: 20,352.24
Why we like it:
There is a pullback support level that is slightly above the 38.2% Fibonacci retracement.
Take profit: 21,779.63
Why we like it:
There is a pullback resistance level.
Enjoying your TradingView experience? Review us!
Please be advised that the information presented on TradingView is provided to Vantage (‘Vantage Global Limited’, ‘we’) by a third-party provider (‘Everest Fortune Group’). Please be reminded that you are solely responsible for the trading decisions on your account. There is a very high degree of risk involved in trading. Any information and/or content is intended entirely for research, educational and informational purposes only and does not constitute investment or consultation advice or investment strategy. The information is not tailored to the investment needs of any specific person and therefore does not involve a consideration of any of the investment objectives, financial situation or needs of any viewer that may receive it. Kindly also note that past performance is not a reliable indicator of future results. Actual results may differ materially from those anticipated in forward-looking or past performance statements. We assume no liability as to the accuracy or completeness of any of the information and/or content provided herein and the Company cannot be held responsible for any omission, mistake nor for any loss or damage including without limitation to any loss of profit which may arise from reliance on any information supplied by Everest Fortune Group.