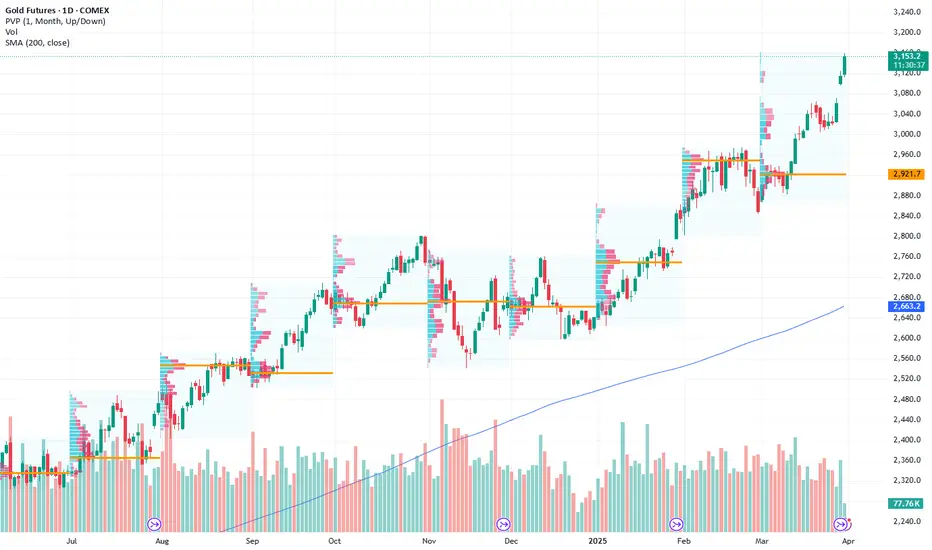
Gold 2025What does Gold have in store for us, i still believe we get a deeper correction before we continue the rally higher. The way I see the market playing out is indicated. I do think that $3000 will be a reasonable target before we probably revert to a range of $2000/$3000
ORO1! trade ideas

Gold Futures: Flight of the PhoenixCOMEX:GC1!
Gold Futures Analysis:
Gold futures are currently presenting a clearer picture compared to equity index futures. Crude oil futures, on the other hand, have already priced in much of the recent tariff news, with a reversal observed from the 2025 mid-range back towards $65. Despite heightened volatility, the WTI crude oil market remains relatively balanced, with bearish sentiment materializing, if prices drop below and stay below the $65 mark.
Gold futures, however, are offering more defined risk-reward opportunities at the moment. Our analysis shows a macro bullish trend in gold, along with price discovery and market auction trends visible on lower timeframes.
On the 4-hour chart below, we observe a rising upward channel, with key levels identified and reasoning for these levels labeled on the chart.
Key Levels:
• ATH: 3201.6
• HVN (High Volume Node) for long entry: 3115
• LVN (Low Volume Node)/LIS for short entry: 3095.1
• Key LVN Support: 3003.7-3018
Scenario 1: Bearish Continuation
If Gold futures stay below the trend line that defines both our long and short trade ideas, the bearish scenario could materialize. For a short trade to be viable, we would look for a close below the LVN/LIS level (3095.1) and enter on a pullback, targeting the major LVN support zone around 3018.0.
Example trade parameters for Scenario 1:
• Entry: 3095.1
• Stop: 3125
• Target: 3018
• Risk: 29.9 points
• Reward : 77.1 points
• Risk to Reward Ratio: RRR=77.1/29.9 ≈2.58
Scenario 2: Bullish Reversal
In the event that Gold futures push back towards all-time highs due to heightened uncertainty and a flight to safety, we expect initial profit-taking by shorter timeframe traders to provide a pullback. This could present a long opportunity towards the all-time highs.
Example trade parameters for Scenario 2:
• Entry: 3115
• Stop: 3095
• Target: 3200
• Risk : 20 points
• Reward : 85 points
• Risk-to-Reward Ratio: RRR= 85/20 = 4.25
Important Notes:
• These are example trade ideas, and traders are encouraged to do their own analysis and preparation before entering any positions.
• Stop losses are not guaranteed to trigger at specified levels, and actual losses may exceed predetermined stop levels.


Not Even Gold Escaped the Volatility of Liberation DayWe finally saw the shakeout on gold I was expecting around $3000. This clearly changes things for gold traders over the near-term, even though the fundamentals remain in place for bulls. I highlight key levels for gold and take a look at the devastation left across key assets on Thursday.
Matt Simpson, Market Analyst at City Index and Forex.com

Hilarious algo failImagine getting one hour to think about what to do after the Trump speech, and coming up with the idea to sell your only winner (gold futures) at market price immediately after the one hour break, lol. Probably sold it to buy more index futures, lol, morons.
Apparent that is what at least one of the algos did. It looks like all of the algos are desperate for cash right now because gold futures are not tracking spot price. (I posted a plot)
If you bought GLD like I did, look at spot pricing XAU/USD tomorrow, not futures GC1!. We're up over 1% now.

GOLD - WEEKLY SUMMARY 24.3-28.3 / FORECAST🏆 GOLD – 5th week of the base cycle (15-20+ weeks). After a brief correction at the pivot forecast on March 19 (see the previous post), gold resumed its bullish trend at the extreme forecast on March 24 – the midpoint of retrograde Mercury.
⚠️ Holding the long position from the extreme forecast on March 3. The movement range to the pivot forecast on March 19 for GC futures exceeded USD12K per contract. Those who took profits, I hope you reopened long positions. The next extreme forecast for gold is April 7.

Long trade
Pair GC1!
Buyside trade
NY Session PM
Thu 3rd April 25
7.00 pm approx.
Entry 3175.7
Profit level 3196.6 (0.66%)
Stop level 3173.6 (0.07%) RR 9.95
Reason: Observing price action on the 1min TF seemed indicative of a buyside trade based on the narrative of of demand and demand for directional bias. Entry 1min TF
1min TF overview

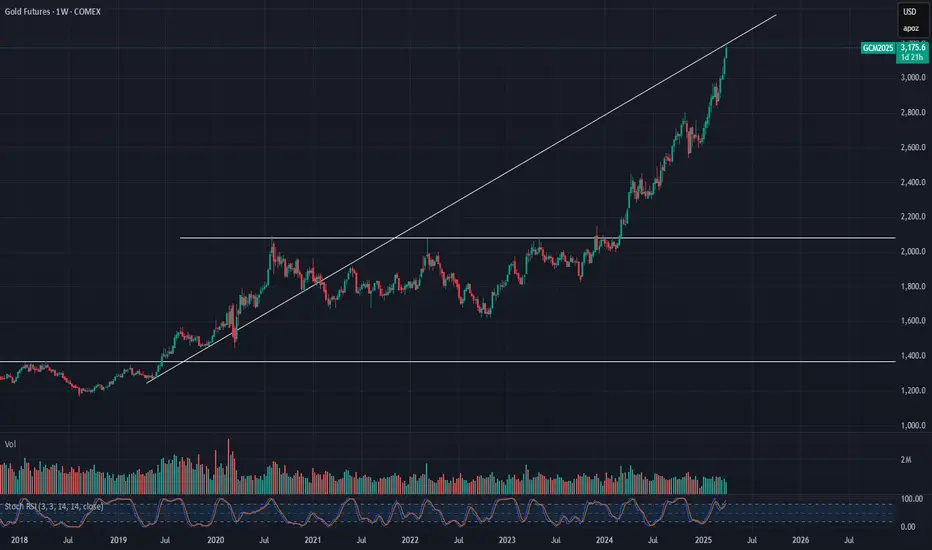
Year ahead 25' GoldGOLD Analysis
The uptrend channel remains intact, with price currently trading near the uptrend line. I’ll shift to lower timeframes to explore intraday opportunities.
Always consider all potential price movements and prioritize trades with the highest probability of success. Remember, patience and precision are essential for maintaining an edge in the markets.

Gold running out of Gas to keep pushing up!I have been waiting for a solid pull back. Price looks like it wants to give it up. But since it is so bullish I have to wait for it to show its hand first before assuming. If price wants to continue with the strong bullish action I feel they need to come back and correct some of the price action first. Looking for signs they want to continue for Asian Session.

GOLD - New Week, New Month, New Quarter! = Opportunity Gold has not been moving how I feel it normally should. The last 2 weeks have been extremely bullish with no significant pullbacks. I believe they wanted to close last month completely bullish before they offer the solid pullback that we are looking for. Also this is a new quarter. Taking it easy as we come into this new quarter but keeping a eye on all the signs for direction.


GOLD MCX MINOR RESISTANCEGOLDMCX
Gold Mcx has seen huge bull run today on 10th April 2025 (Thursday), Looking at the chart it can be clearly seen yellow metal on MCX is trading in upwrad trending channel pattern and around 92400-92500 Channel Pattern Resistance can be observed. There can be some profit booking seen from current levels, One can get out of long positions and reenter long position once GoldMCX closes above 92500, till then book profits on Long positions, or sell Gold MCX with Small stoploss of 92600


GOLD - Prepare for Extreme Volatility**Week of:** April 7–11, 2025
**Status:** Parabolic Phase | Euphoria Peaking | Structure Fragile
---
## 🧠 Thesis
Gold has shifted from trending to **momentum-driven price action**. We're now in the parabolic stage of the breakout — where belief is at its highest, structure is at its weakest, and volatility becomes the release valve.
This is no longer a trend-following environment. It’s a **sentiment-pressure zone** where intraday risk expands sharply.
---
## 🔍 Key Signals
- Parabolic curve formation
- COT shows aggressive commercial selling
- Open interest is peaking with sentiment extreme
- Weak closes despite strong highs = possible exhaustion
- Structure thin above breakout zone = high whipsaw risk
---
## ⚠️ What to Expect
- Intraday **fakeouts and rejection candles**
- **Range expansion** in both directions
- Emotional breakout chasing followed by sharp reversals
- Market-wide volatility spillover if rejection confirms
---
## 🛠️ Strategy Guidance
- Avoid breakout chasing — look for **confirmation first**
- Fade emotional spikes only after rejection candles
- Focus on **tight invalidation and reduced size**
- If it holds and extends, trail stops closely — **don’t get greedy**
---
> “When price goes vertical, risk doesn’t rise gradually. It explodes.”
---
## ✅ Summary
Gold is in its most unstable phase — euphoria is priced in.
Whether this is continuation or climax, **volatility is guaranteed.**
Trade with precision, or not at all.

GOLD - WEEKLY SUMMARY 31.3–4.4 / FORECAST🏆 GOLD – 6th week of the base cycle (15–20+ weeks), nearing the end of phase 1. Market turbulence usually weighs on gold, so the sharp correction on Thursday–Friday, which wasn’t supported by any extreme or pivot forecast, didn’t come as a surprise. That’s what stop-losses are for.
⚠️ The working range of the long position from the March 3 extreme forecast to the March 19 pivot forecast in GC futures exceeded USD12K per contract. The working range from the March 24 extreme forecast to the stop was USD6K per contract. Congrats to those who entered. Special thanks to Mercury retrograde, as the March 24 extreme forecast was its midpoint. The next extreme forecast is on April 7. The next pivot forecast is on April 14.


INTRADAY MOVEMENT EXPECTEDi can see still there is liquidity above at the poc of the weekly volume
but if the price can cross up the level it can visit the next resistance above
so if the price at london session cross down the value area i will expect visit the levels shown on the chart as support and make the rejection
so we have to follow the plan and and use the levels on the chart risk management safe the profit secure the orders after the price move stop at break even
we wish happy trade for all


Long for Gold: Seizing Safe-Haven Opportunities Next Week
-Key Insights: Gold is maintaining its robust uptrend as it benefits from global
economic uncertainties, making it a favored safe-haven asset. Investors are
moving towards gold due to geopolitical tensions and a volatile stock market.
The precious metal's performance is strong compared to other sectors, with a
bullish outlook supported by experts and analysts.
-Price Targets: For the upcoming week, traders should consider the following
targets and stop levels for long positions: T1 at 3155 and T2 at 3220,
indicating potential gains. Set your stop levels at S1 of 3080 and a more
conservative S2 of 3050 to mitigate risks.
-Recent Performance: Gold has showcased a strong and consistent uptrend,
distinguishing itself amidst broader market volatility. Its appeal as a safe-
haven asset has attracted investor interest, particularly as geopolitical
tensions and trade developments influence market dynamics.
-Expert Analysis: Analysts maintain a bullish perspective on gold's trajectory.
Despite warnings of possible corrections if certain resistance levels are met,
the overall sentiment is optimistic. Experts emphasize the strength of gold in
current economic conditions, underscoring its appeal.
-News Impact: Ongoing trade war developments and geopolitical tensions are
significantly impacting gold prices, reinforcing its position as a safe haven.
Investors are advised to stay informed about tariff changes and policy shifts,
which can influence demand and drive price momentum.
In conclusion, gold remains in a favorable position, driven by persistent
economic uncertainties and investor flights to safety. Targeting the specified
levels can optimize outcomes for those positioning long in the market next week.