$MATIC - POSSIBLE JUNE TARGET $1.75matic is in a good spot here
showing signs that price discovery is about to kick in
good luck to holders & traders
MATICPERP trade ideas

MATIC in Cup Formation - preparing to reach .618 extension? Looking at this formation in MATIC I'm anticipating a reach towards the .618 level within the next two weeks before retracing toward the .5 level to form the handle.
We shall see...

Wedge ConsolidationMATIC forming a wedge pattern right on the 21 day. Think this breaks out to the upside if BTC can recover.
A little bit of profit taking and rotation into laggard L1s occurred but seems pretty mild so far. Volume/selling pressure has died down over the last several trading days.
MATIC still has one of the best charts in crypto atm


Polygon may be the ONLY crypto in its 3rd wave rally!Polygon (MATICUSD) stands alone atop the crypto space. Despite all the volatility and pattern invalidations seen across so many of the other cryptos, Polygon somehow manages to keep chugging along. The nested '1-2,i-ii' setup covered over the past 2 updates is alive and well! The rally is so powerful that the alt RED bearish pattern is invalidated! Yes, Polygon has actually managed to INVALIDATE its bearish RED pattern! If this isn't a 3rd wave, I don't know what is!
Primary PURPLE Pattern:
Polygon is looking at logarithmic Wave 3 projections of 4.86 to 6.35 with 6.35 being a likely strong resistance. Wave 5 projects to 7.49 to 9.78 but with a strong likelihood of extending to the resistance level at 12.85. There IS an outside shot that Polygon extends all the way up the major 0.618 extension level of 26.31 as our final top! But that will remain of low likelihood until we see strong extensions within the 3rd wave first. If history and fractal patterns serve as any indication, there's a solid chance of seeing a parabolic 3rd wave with this one!
Bearish RED Alt Pattern:
So with all the bullishness in Polygon, there must be a bearish alt pattern, right? Absolutely! What I have come up with is that our PURPLE subwave (1) and (2) could actually be RED A and B waves, respectively. And that would make our current rally since September 23rd an ENDING DIAGONAL C-wave. This A, B and C would make up the larger B-wave fake-out rally in this alt RED pattern. Right now, I'm not seeing anything bearish to make this a high-probability, but dipping back below 2.28 and then 1.90 would certainly catch my attention. And ending diagonals precede sharp reversals, so things could get really ugly really fast!
I use Elliott Wave analysis to project price levels for different assets and asset classes. EW is a form a technical analysis that is absolutely NOT based on fundamentals. Please be aware that this is not intended to act as financial advice. I am not a trained or certified financial professional. You may invest based on a strategy tailored to your own skill and risk-tolerance levels.
#matic #polygon #polygoncrypto #maticnetwork

MATIC compared with ETH 2017 @@ lfgMATIC compared with ETH 2017
:)
no explanation necessary. damn things almost identical.
now compare it to ada.
the question you should be asking yourself is ; can i get more than 5x elsewhere? and with such apparent guarantee.. im not sure now. the way alts been acting lately (ie basically retracing their entire runs on a lot of them) they look weak asf.
now let us pray this game of musical chairs aint over here. or covid doesn't whip out a more deadly strain for us all.
have wonderful new years degen brother and sisters
x

TRADE PLAN FOR MATIC FOR PROFITShello guys, a look into matic and its potentials, from the chart we will notice how price falls within the channel and we expect a bounce at the support zones indicated.
Follow the with aprrorpiate buy enterings.
Tradehubng.

Review of MATIC 6 hour chartI am reviewing MATIC movement for the next couple days and although I did not see the right side of the head and shoulders pattern, The MACD does look bearish and its likely for it to move downwards over the next two days. Please chime in with your thoughts; I will follow up with an analysis of the Daily timeframe.


MATIC SHORT TO $2.19 (or) $1.97A quick analysis on MATIC using both wave theory, Fibonacci analysis :
Wave theory Analysis:
1) MATIC had a nice IMPULSE run-up from Jul 18th to Sep 4th going from $0.61 to $1.78 after a big correction from the previous high of $2.81 to $0.61
2) After a good impulse phase comes the CORRECTION phase, markets usually stay two-thirds of the time in a correction phase
3) Looks like the 2nd wave correction is a simple zig-zag correction touching the support at $1.01 on 25 Sep 2021
4) New impulse Wave 3 then started from $1.01 on 25 Sep 2021 and ended at $2.91 on Dec 26, 2021
5) Wave 3 are usually the longest in the 5 wave series and this seems to be a perfect extended W1
Fibonacci analysis :
1) Wave 2 retraced perfectly at 61.8% of Wave 1 to at $1.01 on 25 Sep 2021
2) Wave 3 extended perfectly at 161% of Wave 1 to $2.91 on Dec 26, 2021
3) Now its time for Wave 4 which I think might take support at 23%, 38% or 50% retracement
4) Right now the Fib 23% is being tested at $2.47, if it doesn't hold maybe next support at 38% $2.2 or at 50% at $1.97
5) Once the FIB 23, 38 & 50 are tested then it will be on its wave 5
Pattern Analysis:
1) In the short term it fits into a nice classic head and shoulders pattern
2) The second shoulder is being just completed
Summary :
-------------
1) Looks like the bears are still in control on Wave 4
2) The support line Fib 23% is being tested at $2.47, if it doesn't hold maybe next support at 38% $2.2 or at 50% at $1.97 should be tested
Happy New year and happy trading guys !!!!!

Matic DistributionI've got a fun one. I've been looking for some alt coins that have not had their major sell off yet and this one looks perfect. After its high in May there was a big increase in supply the day after in which thereafter it attempted a rally (Automatic rally) on increased effort yet a new high could not be made which we call the secondary test. then after that it came back down to make a lower low in July being the sign of weakness which starts the distribution process in which usually you want to see a higher high then the Buying Climax. which was finally achieved just a few days ago. Now even though the higher high(Upthrust) was made it could still run a bit higher although we don't know for certain whether it wants to continue on higher ill say its either already there or its getting close. I think it may depend on bitcoin, which is at a make or break point, a fall below the September low would really make the case for it. I am looking for an entry on a short on Matic and ill be looking for weakness on bitcoin to make that entry if bitcoin rallies further then ill wait but if i start to see it showing weakness i may make an entry with stops set fairly close and move my stops down as it progresses so that in case it does rally i wont get stopped at a loss.

MATIC - AUTOMATIC BULLWatch this one move...
Stocks & Metals are suffering AMEX:BITO
Buying non-stop bots will slam sellers
COINBASE:MATICUSD
BINANCE:MATICUSD
FTX:MATICUSD
BINANCEUS:MATICUSD
BITTREX:MATICUSD
KRAKEN:MATICUSD
GEMINI:MATICUSD
BINANCE:MATICUSDTPERP
POLONIEX:MATICUSD
BITSTAMP:MATICUSD
BUY


MATIC Potential Double TopMATIC is trending higher inside of an uptrend channel, but is putting in a potential double top. Price is trending above the short-term moving averages with all moving averages in a bullish cross. Lower indicators are all showing bullish trend and momentum behind price. Should MATIC pull back on double-top resistance watch for support in the $1.70-$1.45 area with additional support at the 200sma. A move above the double top and to new highs would indicate uptrend continuation.

Polygon (MATIC) About To Set New All Time HighsPolygon (MATIC) has been on a nice steady uptrend and doesn't show much signs of slowing down. Matic has continued to set higher lows and higher highs. Fundamentally there's a lot of positive momentum and sentiment in Matic considering their utility when it comes to NFTs, Ethereum Scaling, ZK rollup technology, metaverse, and gaming. These are all strong narratives that will continue to grow through out 2022.
As of right low local support is at $2.40 -$2.50. A lot of accumulation happening around $1.85 - $2.00.

MATICUSD (1H) Bullish reversalHi Traders
MATICUSD (1H Timeframe)
Waiting for the upward break of 2.62 resistance level, which will complete a bullish trend reversal pattern to go LONG. Only the downward break of 2.40 would cancel the bullish scenario.
Trade details
Entry: 2.62
Stop loss: 2.40
Take profit 1: 2.75
Take profit 2: 2.97
Score: 5
Strategy: Bullish reversal

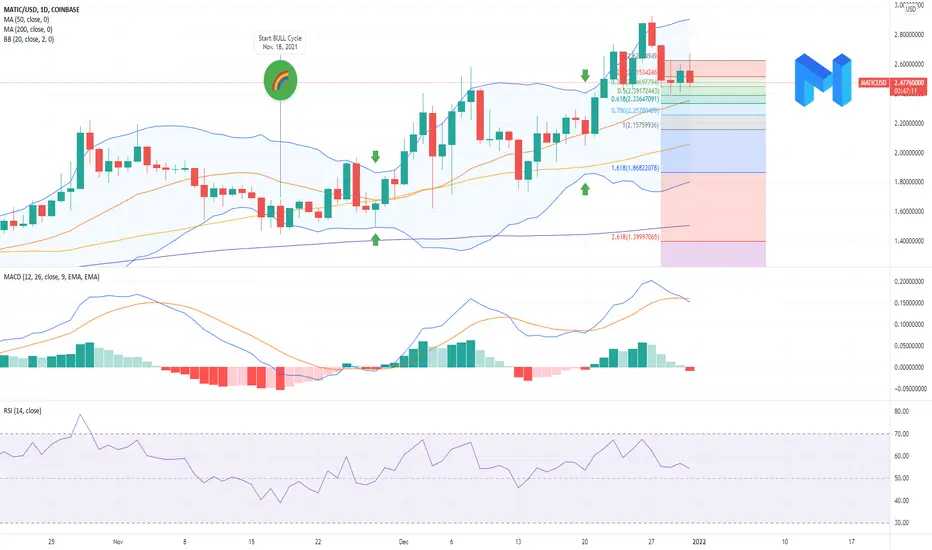
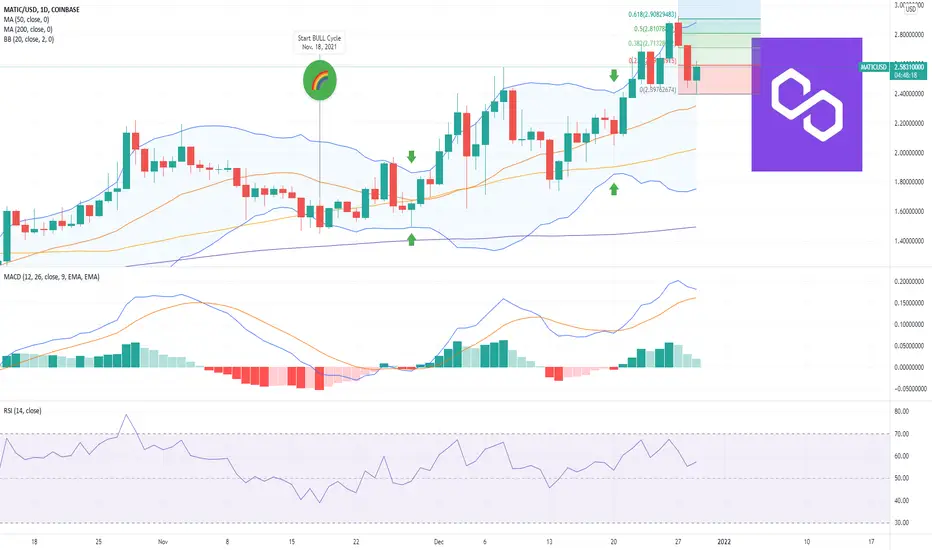
Polygon ($MATIC) New FIBPolygon ($MATIC) New FIB: MATIC started its BULL cycle last month and after 2 BB squeezes to the upside, $MATIC made ATH on Dec 27, 2021 ($2.92). Lots of momentum left for $MATIC to keep up with the pace. Market is not even close to being over-bought so more upwards price action "is on the horizon"
MATIC could be ahead of a major rally.My most recent MATICUSD analysis was on the short-term, where the Channel Up patterns accurately illustrated a target for us:
Now that this short-term 3.000 target was hit, I am shifting my focus on the longer-term correlations. With the use of the CCI on the 1D time-frame, I've spotted this fractal which if repeated, will be extremely bullish for MATIC.
As you see, we are at the end of a Higher Highs pattern (green Triangle), which is similar to the one formed in January 2021. Those were the last days of MATIC accumulation before a major parabolic rally broke out. The CCI sequences are identical. Practically what this suggests, is that if the Higher Highs trend-line breaks (dashed lines), the coin may start a parabolic rally that can easily double or triple in price.
Do you expect this to play out in the same way?
--------------------------------------------------------------------------------------------------------
** Please support this idea with your likes and comments, it is the best way to keep it relevant and support me. **
--------------------------------------------------------------------------------------------------------

MATICUSD 1D - Playing with Fibonacci RetracementHi everyone,
Thank you for considering reading my idea.
Here we can see that MATIC is bouncing/rejecting off of different Fibonacci levels.
A. Rejected at 0.5 level
B. Bounced at 0.618 level
C. Rejected at 1.618 level
D. Bounced at 0.618 level
E. Rejected at 1.414 level
F. Bounced at 0.786 level
G. Rejected at 1.618 level
H. Expecting a bounce at 0.618 level around 2.2?
Like this idea and follow me for more analysis like this. TAYOR.
Cheers,
Juvs

