Head Shoulders is creatingChart 4H TF
BINANCE:MATICUSDT is creating a inverse head shoulders
Matic has the support around 0.53 so need wait a confirmation
Wait for next move to see happen
MATICUSDT.3S trade ideas

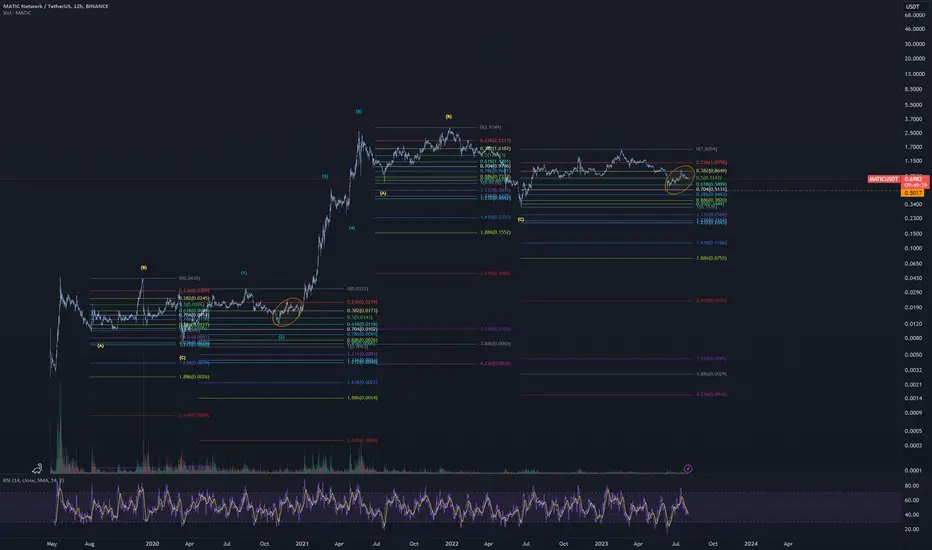
#MATIC HTF super bearishIn this chart I tried to predict all possible scenarios and highlighted the most strong resistance (red lines) and support (green lines) levels.
Since I am trying to make understanding my TA easier. I marked every possible move of the coin with numbers.
Now let me explain every number:
1. Matic bounces until Monthly 50 ema support at the level 0.63$ and from that level we get bear reaction. It can be long wicks above the candle or bearish divergence on LTF. In this case the probability to see downward move towards to 0.25$ increases
2. The coin goes higher to 0.72$ where it faces with W FVG and D 100 ema resistance - we see bears reaction in this case price comes back to 0.63$ and below.
3. Coin breaks through 0.72$ resistance, retests that level ( because it becomes a support) and in this case the continuation of the uptrend increases and we may see the coin around 0.92$
4. The coin faces 0.92$ where there is M FVG + Weekly 50 and 100 ema resistance. We see bears reaction in this case Matic welcome back to 0.72$
5. The coin breaks through 0.92$, would be nice to see the retest of that level, in this case the coin go higher to 1.1$ and etc

MATIC long term perspectiveBased on the weekly timeframe's Trendline and Chart Pattern , here's my outlook on how the price of MATIC might evolve over the next few months

Matic possible drop downOn a weekly timeframe, we can observe a downtrend in Matic within a parallel channel, following the pattern of Lower Highs and Lower Lows, which constitutes a bearish structure. Moreover, if we connect the lows of June 2022 and June 2023, we can identify a robust support line. However, this line has now been breached, leading to a decline in Matic's price. The RSI on a weekly level is at 33, indicating an oversold condition that is yet to manifest fully. The MACD has remained in negative territory for over 4 months.
The level of $0.58 served as a sturdy support for Matic, providing strength during the Bitcoin crash from $30,000 to $25,000 in June 2023. Subsequently, Matic's value surged above $0.85. However, during the recent crypto market crash, Matic failed to maintain this support and commenced a breakdown. Presently, Matic is trading at $0.54. It has already closed below $0.58 and is undergoing a decline. Matic's RSI is at 22, and the MACD remains in negative territory, indicating an oversold condition. This suggests a potential minor rebound in the upcoming days. Nevertheless, comprehending the current market sentiments is crucial. If the sentiments exhibit sufficient strength, a recovery to $0.58 might be possible. Nevertheless, our previous sentiment analysis indicates poor market performance, highlighted by the dismal weekly closure last week. A staggering amount of over $1 billion was liquidated from the market in a single day, instilling fear among retail traders. Moreover, market volume remains lackluster. The sentiments are decidedly bearish for now. Should we observe a decline in traditional markets like NASDAQ and S&P500, a corresponding drop in cryptocurrency prices can be expected.

MATIC Fib levels remain ultra bullish until...Lets see what we had in the first run:
Corrective ABC on 1.272 for C after first leg and sharp bounce on right on 0.618 after the following impulse's correction
Lets see what we just had:
Corrective ABC on 1.272 for C after first leg and sharp bounce on right on 0.704 after the following impulse's correction
Suppose while the recent low @ $0.5131 holds bulls are in favor to hit their final 4.236 fib target > $18
If it doesnt hold, next levels to watch out would be 0.886 @ $0.38, 1.272 @ $0.2 and finally the recent breakout zone $0.03
---
If you like my content, if it helps you gain profit, give it a like!
Thanks!
---
Hold my beer pls
----
No financial advice, do your own research, don't be stupid
Matic rangingWaiting for Matic to break the current range
Matic is moving towards the previous low, with this volume a new low is to be expected.

MATIC/USDT longDirection: ⬆️LONG
--
Position Size: 2 - 4%
Leverage : 3 -5X
Trade Type: SWING
--
Lying above the horizontal support
ENTRY : 0.51 - 0.579
(OTE: 0.54 )
🔘Target 1 - 0.59
🔘Target 2 - 0.61
🔘Target 3 - 0.63
🔘Target 4 - 0.65
🔘Target 5 - 0.68
🔘Target 6 - 0.72
🔘Target 7 - 0.76
🔘Target 8 - 0.80
🔘Target 9 - 0.85
🔘Target 10 -0.90
🚫STOP LOSS: 0.49
RISK: Medium/High

#LQR #TOBTC #MAtic 3DayThese Price lables are important support zone for Matic
which is gives you mid-term Spot Trade ...
Do you'r own re-search DOYR!


#MATICUSDTthis pattern has been defined as a TREND pattern in which wave 3 is extende . it is the most probable trend pattern to occur very often wave 1 is equal to wave 5 in time and price when a third wave is extende .
Wave 4(ZigZagFlat):
this pattern has been defined as a sharp Corrective pattern which is ahybrid of a zigzag and a flat.the B wave retraces more than 62% and the A and C wave should be a trend pattern.
This wave 4 will be ended at 0.2858 or 0.1371, but 0.1371 will be more likely.

Swing Trade - MATICFor this setup what I'm looking to take is a momentum and moneyflow reversal SHORT either at the Previous Range VAL, the PoC (Point of Control), or the bottom of the previous Channel.
Depending on the opening on Tuesday after the holiday, we'll see how fast MATIC moves and note this compared to BTC/ETH to get an indication at which level we should see the stall occur and take a reversal.
I would be interested in a LONG if MATIC pumps through the bottom of the channel and retests the channel bottom.
Good Luck!

Homework_2_fiba_manvelovGlobal and standard fiba
Adjusted after correction and rearranged fiba each time after 0,618 level was reached


$MATIC Swing ShortAveraged-in around 0.72
Stops currently flat.
See the previous two trendline breaks? Yeah..... enough said.
Targets marked. Let's see.

MATICUSD ❕ strong supportRSI indicates oversold on the 4H TF.
TD Sequential formed an up reversal signal at 1H TF.
I think the asset will correct after testing the support.

Very LONG ✅ 🦅First Follow This Page For Giving A Profitable Signals 🦅💰✅
SECOND we have long or buy vision for this POSITION ✅
THIS is not financial advise or something like that ...
Thai is just our trade POSITION ✅🦅

MATIC shortHello guys , If we close below 0.94c I expect a big fall down. It only has an hour to go.
Give me like if you agree !

MATICUSDTPossible setup for BINANCE:MATICUSDT
"Daily crypto market analyses I provide are personal opinions & not financial advice. Trading carries risks, so do your own research & seek advisor's help."
Don't forget to like and comment

MATIC/USDT Chart ReviewI invite you to review the MATIC chart in pair to USDT, on a one-day interval. First, we will use the blue lines to mark the downtrend channel where the price is moving in the upper range.
Moving on, we can move on to marking support areas when we start a larger correction. And here the first very strong support is at the price of $0.59, but when the price drops below, we can see a drop to the support of $0.31.
Looking the other way, we see that the price has rebounded from the first significant resistance at $ 0.90, which so far has no strength to break. then second resistance is at $1.03, then we have another resistance zone from $1.16 to $1.34, then strong resistance at $1.56.
When we turn on the EMA Cross 200, we see that the price rebounded from this line and thus remained in a strong downtrend.
Please look at the CHOP index, which indicates that there is still energy for this move, the RSI has a strong rebound with room for the price to go lower, while the STOCH indicator also indicates that there is some energy left for the next move.

What's Next Possible Move of MATIC/USDT? Polygon Analysis💎Attention, Paradisers! Turn your focus to MATIC, as it's gearing up for potential movements, offering a few captivating possibilities.
💎MATIC faced resistance at the OB a few days ago, sparking an upward trend. Yet, with a hint of slowing momentum, it's projected to re-engage with the OB. Should it falter at this juncture, anticipate a bullish continuation from a key support point.
💎Delving into its trajectory, we've noticed a shift from demand to supply, resulting in a pronounced dip.
💎After capturing liquidity from below, MATIC seems primed to climb, targeting the overhead imbalance.
💎Keep a close watch for further insights and relish your trading adventure.

Buy matic here Over sold on four and one hour time frame. So am building my buying /long from from here

Am buying a small bag The rsi indicator is showing over sold on one hour time frame and even four time frame is showing the same movement.

Homework_manvelov_rev_patterns_3This is addition to homework n1 where 3 patterns are added
Addition N3 where BR2 is important
