MATIC flag patternMATIC has a bullish flag pattern on Weekly time frame,now the price is trying to breakup the flag pattern,we expect another bullish trend will start after breakout and retest..
MATICUST trade ideas

Move 200 % ? Matic !After breaking the weekly trendline and resistance area of 0.9500, we expect a move towards higher numbers.
We can also have a pullback to confirm the trendline, in which case we can expect a 200% move on the weekly timeframe.
This is my analysis, your profit and loss is your own responsibility.
GoodLuck

MATIC → Polygon Pullback then Bounce to New Highs? Let's Answer.MATIC has been caught between a trading zone since November but has finally touched the Support Zone and bounced back above the Daily 200EMA. Should we long here?
How do we trade this? 🤔
The Support Zone was touched and a strong bounce led the price back above the 200EMA. We are currently hovering between the Daily 30EMA and 200EMA with no clear signals to buy or sell. The RSI is around 46.00 and above the Moving Average, another sign for a long position. The only thing we're missing is a solid Risk/Reward Ratio and a buy signal, which requires the price pullback a bit more before we can enter the market.
We ought to target at least a 1:2 Risk/Reward, but I believe we have the runway for a 1:3 Risk/Reward given the distance to the previous high of $1.092. Target the $0.735 price area for an entry and place a stop loss below the previous low in the Support Zone around $0.655, the first Take Profit at $0.815, and the final Take Profit around $0.975 or until you see a sell signal. Move the stop loss up to the entry price when Take Profit #1 is hit to lock in profits.
The first take profit is placed around the 30EMA zone since it may act as resistance. The second take profit is placed just before $1.00 where there has been a few failed attempts to break it since November.
💡 Trade Idea 💡
Long Entry: $0.735
🟥 Stop Loss: $0.655
✅ Take Profit #1: $0.815
✅ Take Profit #2: $0.975
⚖️ Risk/Reward Ratio: 1:3
🔑 Key Takeaways 🔑
1. Trading range after a bull run justified long bias.
2. Contact with the Support Zone followed by a bounce.
3. Price hovering between 30EMA and 200EMA, wait for pullback.
4. Look for long entry around $0.735 for a 1:3 Risk/Reward ratio.
5. RSI at 46.00 and above the moving average, supports long bias.
💰 Trading Tip 💰
It's reasonable to take half profits at the first resistance target in a long trade, or the first support target in a short trade. Using a 1:1 Risk/Reward Ratio for your first target, you can move your stop loss up to your entry price, locking in profits. This allows you to watch the rest of the trade execute without worry of losing money. This helps improve trading psychology and the equity in your account.
⚠️ Risk Warning! ⚠️
Past performance is not necessarily indicative of future results. You are solely responsible for your trades. Trade at your own risk!
Like 👍 and Follow to learn more about:
1. Reading Price Action
2. Chart Analysis
3. Trade Management
4. Trading Psychology

MATICUSDT - Bull Target IdeasUsing trend lines across important areas of MATICS chart development
Using these we can plot a large bull move with two potential profit targets a more extreme one at $17 and a lesser one at $3.
I believe we are on the cusp of seeing a large bull run so pick your targets.

⚫️$MATICUSDT WEEKLY A symmetrical Triangle formation is seen on #MATIC and an immediate SUPPORT around $0.75 - $0.81 and also a RESISTANCE above $0.9.
It looks very interesting, post early January fall of -30% #MATICUSDT has regained around 32.41% and is currently trading at $0.8875.
In any case, the resistance at $0.9 has to be broken above to show more gains for #MATIC and the next confirmation has to be the breakout of the Symmetrical Triangle!
Let's hope for the best and plan for the worst!!
Hit 🚀 if you guys want more Crypto Pairs analysis.
#maticusdt #crypto #marketpdates #thesoumyoroyanalysis


MATIC/USDT Nearing a Crucial Resistance Eyes on the Next Step?💎 Paradisers, get ready for an exciting development with MATICUSDT as it edges closer to a pivotal resistance, hinting at potential upcoming actions.
💎 Observing POLYGON recent patterns, we've noticed a recurring price action. Currently, it's mirroring past behaviors, and if it honors the resistance at $0.9584, we might see a retreat to the support level of $0.7216.
💎 Should the price hit the support at $0.7216, there's a strong chance for a significant bullish push towards the formidable resistance at $1.0970. However, a loss of steam at $0.7216 could trigger a bullish recovery from the deeper support at $0.6594.

MATICUSDTMetic is in a correction phase and can have a deeper correction than other currency pairs
But according to the definition of dominance, Tether can be bullish

MATICUSDT
In my opinion technically it can make an upward movement What is your opinion ? Keep in mind that Bitcoin may undergo some price correction With consideration of the risk consider entering the trade


MATIC GO UP on SOLANAHi MAtic have nice chart for long position i will go on it on 30LVRG with DCA positioning every 3%. Good luck LL

🔥 MATIC Short-Term Bounce SignalMATIC has been trading relatively bullish alongside Bitcoin's recent push upwards. However, MATIC seems to aim for a retest of the bottom support, which would be a great place for a high risk-reward entry.
I'm anticipating BTC to push through 50k in the near future, which will naturally be great news for alts. MATIC could reach 1$ again in the not so distant future.

MATICUSDTMATICUSDT Short at LH (also 0.5 FIB occur , trendline resistance intact)
SL , TP mention in chart

MATIC - New Uptrend?After reaching a 6-month high near $1, the price entered a correction phase represented by a descending trendline, with price compression below it.
Now #Matic has seen an increase in open interest, signaling a new attempt to break the downtrend and start a new uptrend.

Long matic ideaWaiting for price to interact with below 4h fvg. Range low mitigated and price came back to range.


MATIC - Beautiful Wyckoff Reaccumulation Flag w/SpringCRYPTOCAP:MATIC
This Matic flag w/spring has played out many times before within this pair with the same volume profile after sweeping the highs and the lows.
What we love to see is reclaiming support, with declining volume from the highs then coiling into an ABC flag after sweeping the most recent highs prior to the spring is spectacular...
Number Go Up IMO

MATIC ANALYSWe have displayed the trend of the matic currency on a very clear chart... with capital management, you can control the risk and achieve reasonable profits.
Please follow us to provide better service and if you are satisfied, introduce us to your friends

MATICUSDT.1DBased on the provided market data, the cryptocurrency MATIC is currently trading at $0.79 against USDT. The Relative Strength Index (RSI) for 4 hours, 1 day and 7 days are 56.35, 49.23, and 52.23 respectively. These figures indicate that the coin is neither in an overbought nor oversold condition, suggesting a balanced market sentiment.
The Moving Average Convergence Divergence (MACD) for 4 hours, 1 day, and 7 days are 0.0012, -0.012, and 0.023 respectively. A positive MACD indicates that the crypto is on an upward trend, while a negative one suggests a downward trend. Here, the MACD data suggests a mixed trend.
The Bollinger Bands (Bb) for 4 hours, 1 day, and 7 days are 0.80, 0.83, and 1.00 respectively. The current price is below the upper band for all periods, indicating a potential for price growth.
In terms of support and resistance levels, the first, second and third support levels for 4 hours are 0.77, 0.72, and 0.68 respectively. For 1 day, they are 0.74, 0.68, and 0.60. For 7 days, they are 0.68, 0.60, and 0.49. The resistance levels for 4 hours are 0.83, 0.87, and 0.94. For 1 day, they are 0.94, 0.98, and 1.074. For 7 days, they are 0.96, 1.10, and 1.22.
Overall, MATIC is showing mixed signals with a balanced market sentiment. The positive 4h MACD and the placement of the current price below the Bollinger Bands' upper limit suggest potential for price growth, but the negative 1d MACD indicates a possible downward trend. Therefore, investors should closely monitor market trends and indicators, and consider their risk tolerance and investment objectives before making investment decisions.

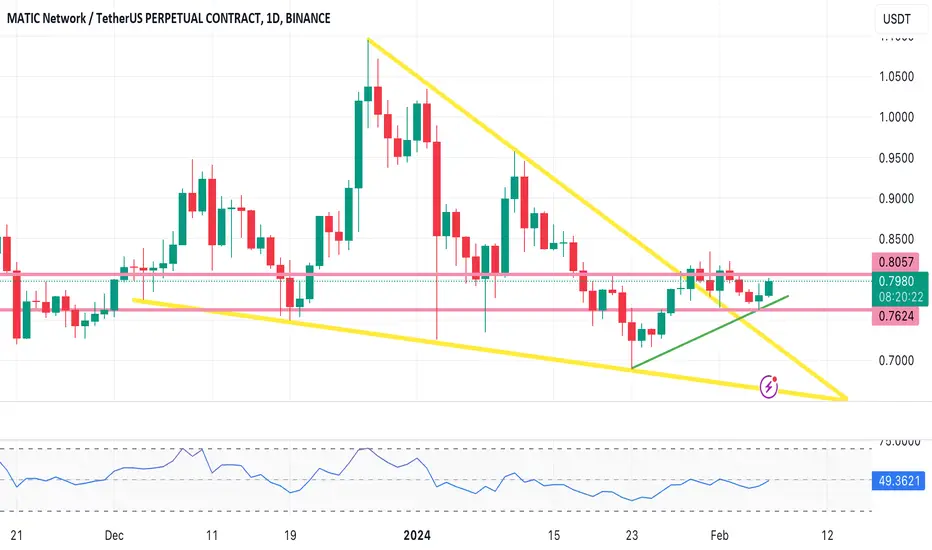
$MATIC BreakoutMATIC Polygon is breaking out from its downward trend. A break above $.8057 will give steam to make it past $.8197 and on its way to $.99.
Do your own research.
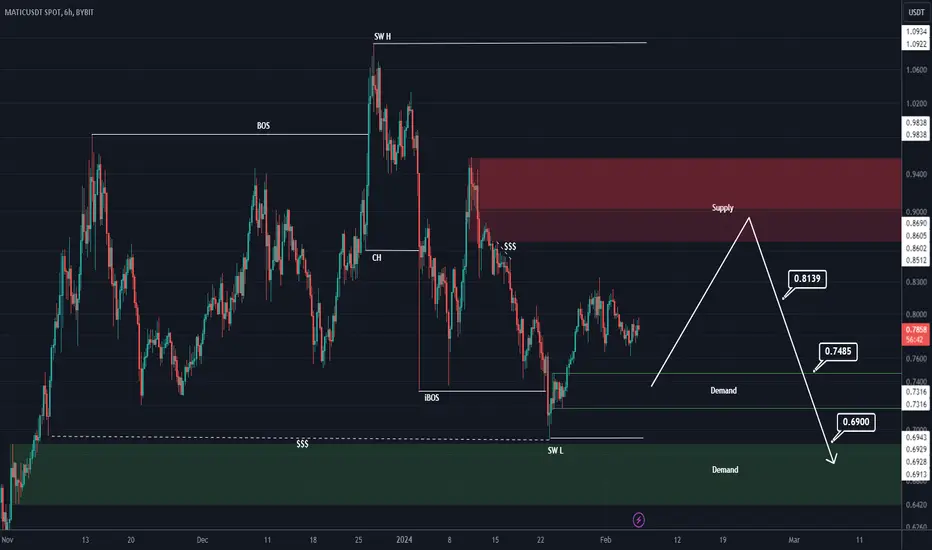
Matic analysis (4H)We have an important supply on the MATIC chart that may cause a drop or change the trend.
We have the change of structure with bearish CH on the chart and we also have supplies that have been mitigated and have moved sell orders to lower ranges with lower H and L.
In case of rejection from Supply, we have specified the targets and
For risk management, please don't forget stop loss and capital management
Comment if you have any questions
Thank You
MATIC ANALYSIS🔮 #MATIC Analysis 💰💰
🌟🚀 #MATIC is trading in a Symmetrical Triangle Pattern. The price is currently trading in a small zone below its descending trendline and a good bullish moment will be confirmed after a good breakout. 🚀🚀
🔖 Current Price: $0.7880
⏳️ Target Price: $1.5072
⁉️ What to do?
- We have marked some crucial levels in the chart. We can trade according to the chart and make some profits in #MATIC. 🚀💸
🏷Remember, the crypto market is dynamic in nature and changes rapidly, so always use stop loss and take proper knowledge before investments.
#MATIC #Cryptocurrency #DYOR

MATIC - 4H - $0,95 - 20% profit possibleMATIC is holding support at current level and can make a bounce up back to $0,95 which is a profit of approx. 20%.

Bullish on Matic Swing LongI am too Buliish on this having alot in spot bags avg buy around 0.68
Longed it here with tight sl from 0.7980.
Stoploss at 7850.
Possibly it can hold here if hold here means reclaimed the trendline and this can Quick sent to 1.2 initially.
The real bull run on this will begin after 1.
HTF currently looks too Bullish.
Note: Not a Financial Advice.
