WHAT IS A LOW RISK ENTRY POINT?WHAT IS A LOW RISK ENTRY POINT?
First off, reminder that you will never find a low risk entry point at a low.
You need upwards movement off a low to start creating the upwards velocity, to create the uptrend, which will lead to the faster, more sustained gains.
The true party starts once the confirmed breakout occurs.
--------------
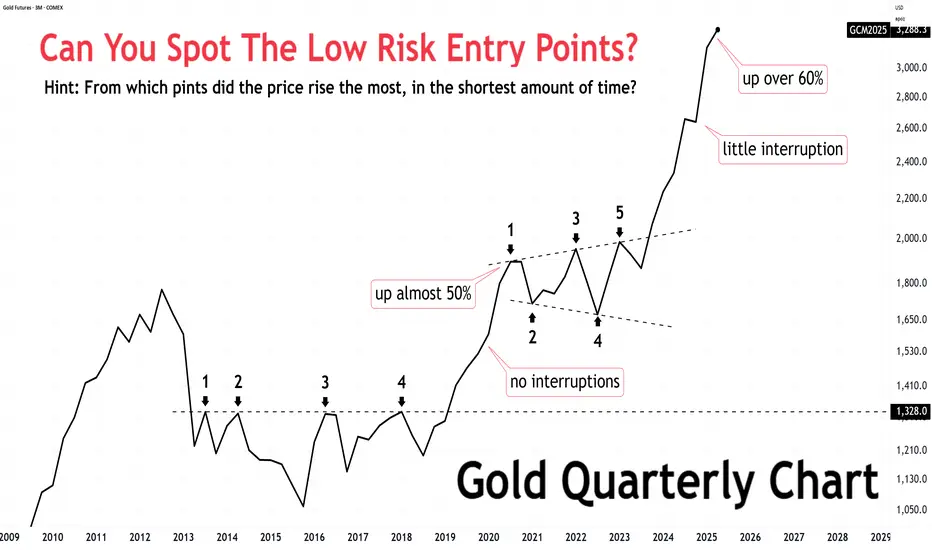
Now, see the gold chart below where I showcase where the greatest gains, in the shortest amount of time occurred.
The first run started in 2019 and had gold run up 50%, without any visible interruptions on the quarterly chart.
The second run started in late 2023 had gold run over 60% (still running).
A chart traders role is to identify the entry points which can lead to this.
Notice the huge bases are found right before those.
There are no huge bases right now. If you missed these entry points, then you missed them.
While price can still trend upwards from here, anybody jumping onboard right now is still considered chasing (not entering at the most opportune time).
--------------
In summary:
Low risk entry points = lesser chances of getting stopped out + higher gains/time ratio
It does not mean results are guaranteed, but they do offer the possibility of obtaining the results showcased here on the gold chart.
So, maybe next time you will recognize these huge opportunities, as we have, and understand that they were the low risk entry points.
Hope this helps you out!
GOLDM1! trade ideas

Gold Update: 2 optionsIndeed, the top metal surged well beyond $3,000, as I mentioned in my earlier post (see related post for details).
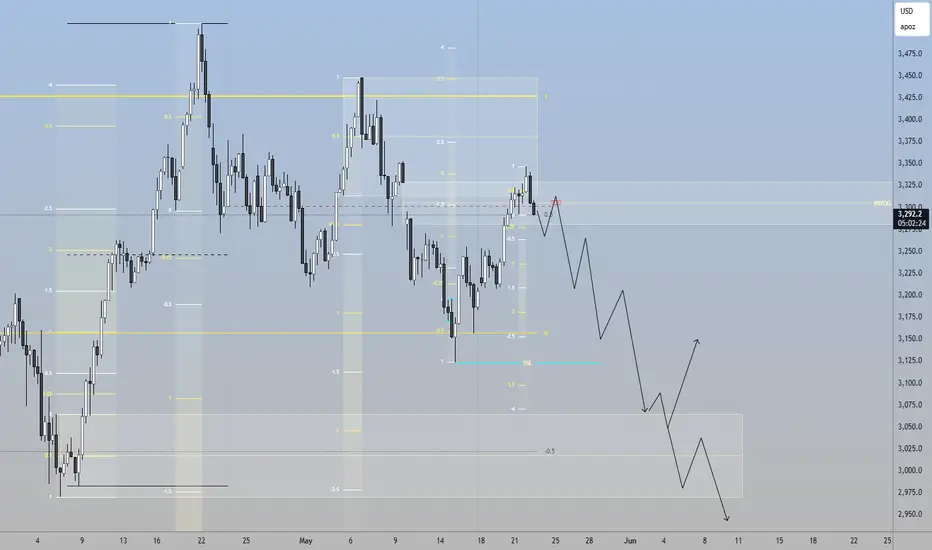
The price reached a new all-time high of $3,510 before pulling back, as expected.
So far, the retracement has been rejected at the trendline support around $3,123 (futures).
From here, there are two possible scenarios:
1) Blue Labels
The price may have already completed wave 4. If so, we could now see a large wave 5 move to the upside.
This wave could reach the blue target box, which represents 61.8% to 100% of the distance from wave 1 to wave 3, added to the bottom of wave 4.
This target zone lies between $3,700 and $4,100.
Keep in mind that gold is a commodity, and commodities often have extended fifth waves — so the higher end of the blue box is still possible.
2) White Labels
Typically, fourth waves retrace down to the valleys of previous lower-degree fourth waves.
In this case, the market could form another leg down to complete a larger, more complex correction, potentially hitting $2,975 before wave 5 begins.
If that happens, the target for wave 5 may be lower, but with a possible extended fifth wave, it could still reach the blue box area.


Market Closed, Breaking Down Gold Outlook...While the market is closed you take the time to clear you thoughts and reset, preparing for a new week. making notes on what I'm thinking we can expect from Gold the coming week. I'm thinking they want to move bullish but I need to see how they want to play it Monday. Monday needs to break levels and hold above those levels to give more confidence hat they want to push bullish. We should find a entry after seeing that.


GoldenZoneFX: Where Data Meets Strategy, GOLD TP Hit!Precision trading isn't about luck—it's about strategy, discipline, and expert analysis. Today at GoldenZoneFX, we executed a data-driven approach that led to a successful GOLD TP hit, proving once again that informed trading beats speculation.
What We Determined Today:
Market structure analysis revealed a key order block, signaling a high-probability trade setup.
Fibonacci retracement levels aligned perfectly with major liquidity zones.
Volume confirmation reinforced momentum, validating our entry and exit strategy.
Why This Matters: GoldenZoneFX thrives on delivering calculated, professional trading insights. Whether you're a seasoned investor or refining your strategy, understanding market behavior through data-driven methods is what sets top traders apart.
Join the @GoldenZoneFX Movement Success isn’t accidental—it's engineered. Subscribe, follow, and stay ahead with real market insights that position you for precision trading.


Gold Futures–High- Probability Bullish Reversal at Key Ord Block Key Technical Insights:
Bullish Trend Continuation Setup:
The price is currently trading within a bullish ascending channel (yellow lines). The overall trend is up, and we’ve seen a recent pullback towards key support areas. This suggests the potential for a bullish reversal, setting up for another move towards the $3,300 resistance level.
Order Block Formation:
We have an Order Block (red box) formed at the lower part of the channel. This is a critical zone where institutional buying has previously occurred, which increases the likelihood of price reaction if it revisits this level.
The Order Block represents an area of significant market demand, and the probability of price bouncing higher from here is high, given the solid historical price action at this level.
Support & Resistance:
Support: The $3,235 level has been a strong area of support (orange line), and we are now approaching this zone. A bounce from here, with confirmation, could provide an optimal entry for a long position.
Resistance: The immediate resistance target lies at $3,290, and $3,300 is the major level to watch for a breakout to the upside.
Trade Setup – Bullish Reversal Opportunity:
Entry:
Look for a long position near the $3,235 support (orange line), ideally at the Order Block (red box). This provides a high probability entry for continuation of the bullish trend.
A confirmation candle (such as a bullish engulfing or hammer candle) would be ideal for confirming the reversal.
Target:
The primary target is the $3,290 level, with the potential for further upside towards $3,300 if the bullish momentum continues. These targets align with the previous price action and resistance zones.
Stop-Loss:
A tight stop-loss below $3,220 ensures protection against invalidation of the setup. If price breaks below the lower part of the channel, the trade thesis would be invalidated, and the position should be exited.
Additional Considerations:
Volume Analysis: Volume has been increasing during the pullback, which suggests that institutional buyers are stepping in around the Order Block area. Watching for volume spikes during the confirmation candle will strengthen the setup.
Moving Average Support: The 200-period SMA is providing dynamic support, which is another indicator that the overall trend remains bullish. A rejection from this level could give further confidence in entering the position.
Risk/Reward: With a risk-to-reward ratio of approximately 1:3, this trade setup offers an attractive potential return relative to the risk taken. The reward far outweighs the risk, making it a high-probability setup for a well-managed trade.
Key Takeaways:
This is a high-confidence bullish continuation trade that aligns with the current market structure.
The Order Block provides a solid area of institutional demand, increasing the probability of price bouncing and continuing higher.
A well-defined entry at $3,235, with clear stop-loss and target levels, creates a structured approach to executing this trade.
Follow @GoldenZoneFX Fore more Valuable Insights.

Gold Futures Analysis: Trade Plan COMEX:GC1!
Gold remains in a strong uptrend on the higher time frames, having recently broken above the $3000 level. This move sets the stage for further upside potential. The chart below highlights a Megaphone chart pattern, signaling volatility and broad price swings.
On the 4-hour chart, a pennant pattern is emerging within the uptrend, marked by a downtrend line from the recent highs. Additionally, an inverse head and shoulders pattern has formed, with a decisive breakout higher towards the 2025 CVAH. This level coincides with a high-volume node (HVN) and the edge of the value area distribution for 2025, suggesting it’s a key point of interest. Some consolidation is expected here before we either continue higher or see a rejection that could pull price back toward the uptrend line.
Scenario 1: Continuation Higher, Capped by 3400 Level
In this scenario, we anticipate further consolidation within the pennant on the 4-hour timeframe. After a brief pause, gold could continue higher, testing the 3400 resistance level. If momentum remains strong, we expect to see price consolidate within the pennant pattern to build energy for the next leg higher.
Scenario 2: Rejection at CVAH
In this scenario, gold struggles to sustain the move higher after breaking out from the inverse head and shoulders pattern. A failure to maintain the rally above the CVAH could lead to a rejection, followed by a retracement within the pennant structure. This would likely set up further consolidation towards the 3200 level before the next move up, possibly testing the uptrend line for support.
Our thoughts:
Gold is currently navigating an important juncture, with key levels at 2025 CVAH, 3400 and 3200 in focus. The near-term direction will depend on how price behaves within the pennant, as well as how it reacts to potential resistance or support levels. Traders should stay alert for volatility, as the consolidation phase could resolve in either a continuation of the uptrend or a pullback towards the trendline. Flight to safety, rising yields and geopolitical tensions will play a key role in shaping sentiment and trend in the Gold market.

GOLD/USD TWO SIDE ANALASIS
Market Structure Analysis:
Higher Low (HL): The early structure highlights a formation of a higher low, suggesting a bullish intent during that phase.
Break of Structure (BOS): A clear BOS is marked, indicating a shift from bearish to bullish market structure, confirming a potential trend reversal to the upside.
---
Key Zones Identified:
1. Opening Gaps:
Two notable opening gaps are marked, one from earlier in the chart and another closer to the current price action. These zones often act as magnets for price due to inefficiencies in the market.
2. Order Block:
A bearish order block near the recent highs around 3,440 signifies institutional selling pressure. Price rejected strongly from this area, adding credibility to its significance.
3. Fair Value Gap (FVG):
A FVG lies below the order block, denoting an imbalance where price may return to fill. This aligns with institutional trading concepts and often precedes a retracement.
---
Support and Resistance Zones:
Resistance Zone: Aligned with a recent swing high and gap, this area around 3,280–3,300 could cap upward moves unless broken with strong volume.
Support Zone: Defined lower around 3,120–3,080, price bounced from here, indicating buyer interest and a potential accumulation area.
---
Forecast Scenarios:
1. Bullish Case:
A projected bounce from the support zone with a potential move toward the resistance zone and eventual fill of the opening gap, targeting 3,280–3,300.
This aligns with the retracement into inefficiencies and institutional areas of interest.
2. Bearish Case:
A possible rejection from the resistance zone, leading to a breakdown and move toward the lower target near the support zone around 3,080 or even sub-3,000, marking a deeper correction or continuation of the bearish leg.
---
Technical Insight:
The chart showcases a textbook smart money concept analysis using structural pivots, order blocks, gaps, and supply-demand zones.
This approach aligns with liquidity engineering, where price seeks to mitigate imbalances and fulfill institutional orders.

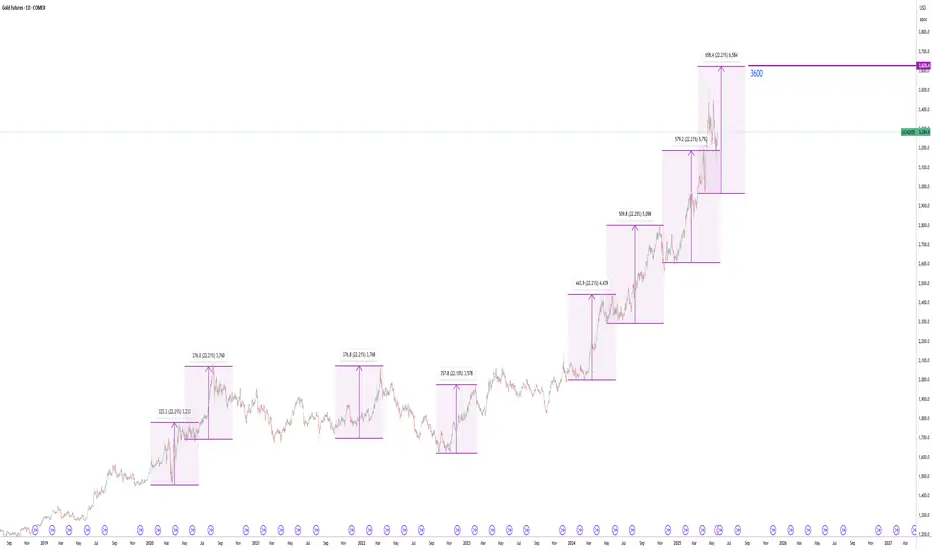
Gold Fib-extension, Almost got every level hit by cup-n-handleJust a simple use of Fib extension with basic settings and reversed to show what a twin peak can do if inverted...
hit pretty much everything.
Don't use the fib extension on meaningless points....make sure they are substantial as in extreme pivots, or a pivot top to bottom and then the top or plateau of that bull trend up.
4hr close up...kinda close eh?:


Strength in Precious Metals ContinuesGold and Silver are showing strength starting off the week after showing gains yesterday and today, with Silver up over 2% and Gold up near 1.5% on the session today. Both Gold and Silver had strong moves higher in 2024, Gold most notable due to the market creating a new all time high price. A big component of the rise in Gold prices had to due with the Fed environment, and with potential rate cuts coming this year there could be continued volatility in the metals due to the changing environment.
While metals are seeing nice gains this week, the equity indices are pulling back slightly today with the S&P and Nasdaq being down near 0.5% on the session. There was little data today and for the rest of the week, and the equities seem to be having some selling pressure after 6 straight days of gains for the S&P and Nasdaq. The CME Fed Watch Tool has seen a pattern this year of the rate cuts getting pushed later in the year, and now the market is pricing in the first rate cut in September, where previous expectations had the first cut coming at the July meeting.
If you have futures in your trading portfolio, you can check out on CME Group data plans available that suit your trading needs tradingview.com/cme/
*CME Group futures are not suitable for all investors and involve the risk of loss. Copyright © 2023 CME Group Inc.
**All examples in this report are hypothetical interpretations of situations and are used for explanation purposes only. The views in this report reflect solely those of the author and not necessarily those of CME Group or its affiliated institutions. This report and the information herein should not be considered investment advice or the results of actual market experience.

Strong Signal Bullish momentum GOLDThere is a break of the channel with strong volume after a consolidation phase that highlights a strong Long position, although if we break the next support combined with a pull back above this new support we might consider looking for the next Resistance that highlighted on the daily frame, nor Fibunnaci retracement for making good decision.
Follow @GoldenZoneFX For more valuable Insights.

AUDUSD and Gold both in a wedge getting ready to break outCOMEX:GC1! FX:AUDUSD
AUDUSD Looks bearish, so far, heading into a tight wedge within a larger bear flag. AUD being commodity currency I am looking at gold as well which too seems to be in bullish descending triangle.But these descending triangle could also break down strongly. There is a potential strong move coming in AUDUSD and high probability it would be to upside
But Its still wait and watch for now

Gold May 29th and went through the analysis of gold which I think is going higher. there is also a gartley pattern . gartly looked at that pattern which he called A 222 pattern as your second chance to get into a market that's reversed... and what I mean by that is that the goal had an impulse and went higher for quite a long. Of time and then after it hit its high the market reversed and went lower and created a gartley pattern..... but in this example the market really was a bullish that went quite a bit higher to new highs.... and I believe gartly was looking for markets,,,, as an example, that went higher and then it corrected and then if it had the appearance of an ABCD pattern the way gartley liked it you could jump in and go long for the market to make new highs. now gartly patterns can work in the other direction and you just flip your thinking and trade accordingly. so I'm not exactly sure that this would be the gartly of all gartly that would make huge moves higher on the gold market.... after all this Market hit its very high in the last couple weeks......... even so, it's still a viable reversal pattern in my opinion but I would be a little bit hesitant to bet the farm that is going to make a new high even though people say gold is going to go to 400 or greater. so be reasonable..

