PERSONAL JOURNAL #11 | VIRGIN GALACTIC [SPCE] | AUG 2025-2028Disclaimer
This is a personal journal of my exploits. This is not financial advice. Always do your own research.
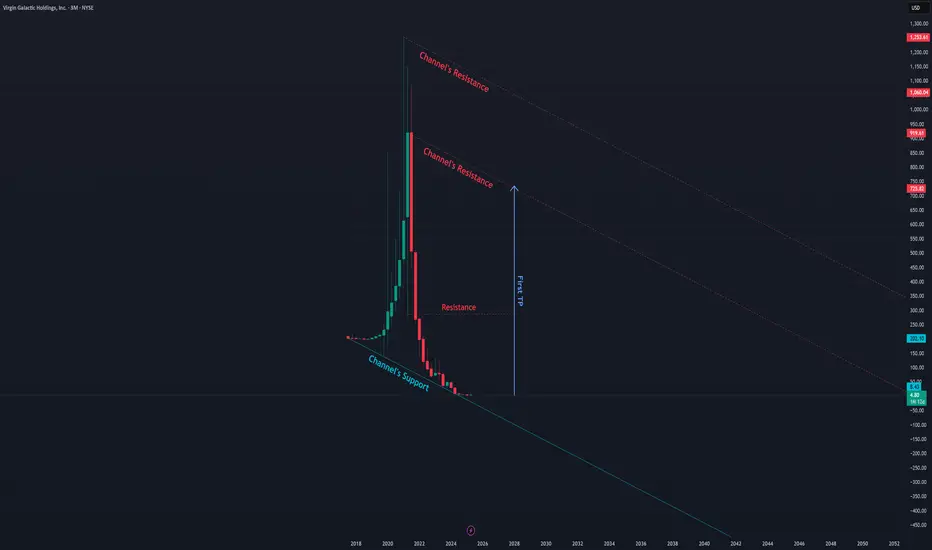
Insight
After a major sell off we finally see the price consolidating in a symmetric triangle, all we know for certain is that in 90-180 days we will see volatility and a breakout, eith
Virgin Galactic Holdings Inc
2.6340EURD
−0.1160−4.22%
At close at 15:45 GMT
EUR
No trades
Key facts today
Next report date
≈
November 5
Report period
Q3 2025
EPS estimate
−1.26 EUR
Revenue estimate
291.56 K EUR
−7.6815 EUR
−334.94 M EUR
6.80 M EUR
56.79 M
About Virgin Galactic Holdings, Inc.
Sector
Industry
CEO
Michael A. Colglazier
Website
Headquarters
Tustin
Founded
2017
FIGI
BBG01C4Y0BV4
Virgin Galactic Holdings, Inc. is an aerospace and space travel company, which engages in the provision of consumer space experience using reusable spaceflight systems. The firm is also involved in designing, developing, and manufacturing, ground and flight testing, spaceflight operation, and post-flight maintenance of spaceflight systems. The company was founded on May 5, 2017 and is headquartered in Tustin, CA.
−20,000.0%
−15,500.0%
−11,000.0%
−6,500.0%
−2,000.0%
Q2 '24
Q3 '24
Q4 '24
Q1 '25
Q2 '25
−90.00 M
−60.00 M
−30.00 M
0.00
30.00 M
Revenue
Net income
Net margin %
Revenue
COGS
Gross profit
Op expenses
Op income
Non-Op income/ expenses
Taxes & Other
Net income
−60.00 M
−40.00 M
−20.00 M
0.00
20.00 M
Revenue
COGS
Gross profit
Expenses & adjustments
Net income
−60.00 M
−40.00 M
−20.00 M
0.00
20.00 M
Q2 '24
Q3 '24
Q4 '24
Q1 '25
Q2 '25
−160.00 M
0.00
160.00 M
320.00 M
480.00 M
Debt
Free cash flow
Cash & equivalents
No news here
Looks like there's nothing to report right now


Stock Of The Day / 05.16.25 / SPCE05.16.2025 / NYSE:SPCE
Fundamentals. The earnings report exceeded expectations.
Technical analysis.
Daily chart: A protracted downtrend, the stock is trading near the all-time low. There is a possibility of a Short Squeeze.
Aftermarket/Premarket: Gap Up on increased volume. We mark the

$SPCE - Virgin Galactic - Value Hail Mary?Fundamental Play:
Current Price of NYSE:SPCE is at $2.77 with 35.53million shares outstanding giving it a current valuation of just around $98,500,000.
SPCE has over $600 million in cash Reserves as of December 2024.
Cash Value vs. Market Cap
Cash and equivalents: ~$657 million
Current marke

Virgin Galactic Wave Analysis – 26 March 2025
- Virgin Galactic reversed from the resistance area
- Likely to fall to support level 3.000
Virgin Galactic recently reversed down from the resistance area between the key resistance level 4.45 (which has been reversing the price from February), the resistance trendline of the daily down channel f

SPCE: Expected Rebound, but More Upside PotentialAs anticipated, SPCE (Virgin Galactic) has reacted within the key Fibonacci zone, between the 1.618 level ($3.41) and the 1.786 level ($2.92), triggering a strong rebound. Our first target is set at $6.16, followed by $7.05, where partial profit-taking could occur.
However, the stock still has more

SPCE class a bullish divergence + falling wedge?On the weekly we see very obvious bullish divergence. There's also a falling wedge like structure forming during the same period.
Arguably, it's about to form a double bottom on the daily as well.
I see at least some upside. As for targets, i didnt set any yet except I'll be taking out half at som


See all ideas
Summarizing what the indicators are suggesting.
Neutral
SellBuy
Strong sellStrong buy
Strong sellSellNeutralBuyStrong buy
Neutral
SellBuy
Strong sellStrong buy
Strong sellSellNeutralBuyStrong buy
Neutral
SellBuy
Strong sellStrong buy
Strong sellSellNeutralBuyStrong buy
An aggregate view of professional's ratings.
Neutral
SellBuy
Strong sellStrong buy
Strong sellSellNeutralBuyStrong buy
Neutral
SellBuy
Strong sellStrong buy
Strong sellSellNeutralBuyStrong buy
Neutral
SellBuy
Strong sellStrong buy
Strong sellSellNeutralBuyStrong buy
Displays a symbol's price movements over previous years to identify recurring trends.
US92766KAA4
Virgin Galactic Holdings, Inc. 2.5% 01-FEB-2027Yield to maturity
—
Maturity date
Feb 1, 2027
See all 1SPCE bonds
Curated watchlists where 1SPCE is featured.


Frequently Asked Questions
The current price of 1SPCE is 2.6340 EUR — it has decreased by −4.22% in the past 24 hours. Watch Virgin Galactic Holdings Inc stock price performance more closely on the chart.
Depending on the exchange, the stock ticker may vary. For instance, on MIL exchange Virgin Galactic Holdings Inc stocks are traded under the ticker 1SPCE.
1SPCE stock has risen by 1.01% compared to the previous week, the month change is a −23.43% fall, over the last year Virgin Galactic Holdings Inc has showed a −57.76% decrease.
We've gathered analysts' opinions on Virgin Galactic Holdings Inc future price: according to them, 1SPCE price has a max estimate of 6.87 EUR and a min estimate of 1.72 EUR. Watch 1SPCE chart and read a more detailed Virgin Galactic Holdings Inc stock forecast: see what analysts think of Virgin Galactic Holdings Inc and suggest that you do with its stocks.
1SPCE reached its all-time high on Jun 14, 2024 with the price of 276.0000 EUR, and its all-time low was 2.1245 EUR and was reached on Apr 22, 2025. View more price dynamics on 1SPCE chart.
See other stocks reaching their highest and lowest prices.
See other stocks reaching their highest and lowest prices.
1SPCE stock is 1.30% volatile and has beta coefficient of 2.11. Track Virgin Galactic Holdings Inc stock price on the chart and check out the list of the most volatile stocks — is Virgin Galactic Holdings Inc there?
Today Virgin Galactic Holdings Inc has the market capitalization of 152.93 M, it has increased by 0.43% over the last week.
Yes, you can track Virgin Galactic Holdings Inc financials in yearly and quarterly reports right on TradingView.
Virgin Galactic Holdings Inc is going to release the next earnings report on Nov 5, 2025. Keep track of upcoming events with our Earnings Calendar.
1SPCE earnings for the last quarter are −1.25 EUR per share, whereas the estimation was −1.99 EUR resulting in a 37.27% surprise. The estimated earnings for the next quarter are −1.26 EUR per share. See more details about Virgin Galactic Holdings Inc earnings.
Virgin Galactic Holdings Inc revenue for the last quarter amounts to 344.65 K EUR, despite the estimated figure of 382.01 K EUR. In the next quarter, revenue is expected to reach 291.56 K EUR.
1SPCE net income for the last quarter is −57.11 M EUR, while the quarter before that showed −78.09 M EUR of net income which accounts for 26.87% change. Track more Virgin Galactic Holdings Inc financial stats to get the full picture.
No, 1SPCE doesn't pay any dividends to its shareholders. But don't worry, we've prepared a list of high-dividend stocks for you.
As of Aug 28, 2025, the company has 744 employees. See our rating of the largest employees — is Virgin Galactic Holdings Inc on this list?
EBITDA measures a company's operating performance, its growth signifies an improvement in the efficiency of a company. Virgin Galactic Holdings Inc EBITDA is −259.06 M EUR, and current EBITDA margin is −5.13 K%. See more stats in Virgin Galactic Holdings Inc financial statements.
Like other stocks, 1SPCE shares are traded on stock exchanges, e.g. Nasdaq, Nyse, Euronext, and the easiest way to buy them is through an online stock broker. To do this, you need to open an account and follow a broker's procedures, then start trading. You can trade Virgin Galactic Holdings Inc stock right from TradingView charts — choose your broker and connect to your account.
Investing in stocks requires a comprehensive research: you should carefully study all the available data, e.g. company's financials, related news, and its technical analysis. So Virgin Galactic Holdings Inc technincal analysis shows the sell today, and its 1 week rating is sell. Since market conditions are prone to changes, it's worth looking a bit further into the future — according to the 1 month rating Virgin Galactic Holdings Inc stock shows the sell signal. See more of Virgin Galactic Holdings Inc technicals for a more comprehensive analysis.
If you're still not sure, try looking for inspiration in our curated watchlists.
If you're still not sure, try looking for inspiration in our curated watchlists.