$ACB 76.8 fib retracement done, -0.27 fib target.$ACB $CGC $TLRYBought a lot of ACB around $3 last week. Went crazy the week, but then retraced to fib 78.6
ACB trade ideas

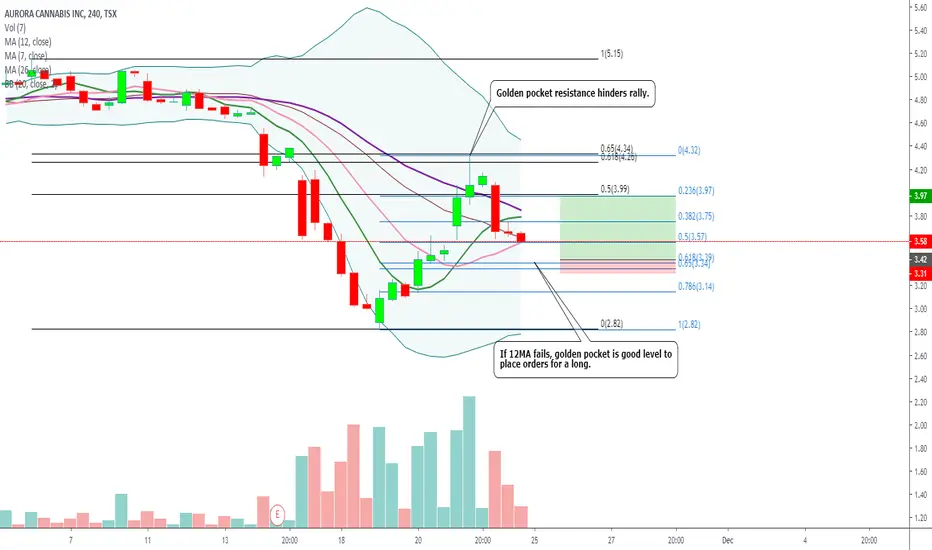
ACB trade setup for Monday. Looking for a long at $3.34-$3.57 laddering in for a strong chance of a bounce at the Fibonacci golden pocket.


ACB sub at $3 buy CAN to $5+ bounce - short term bounceGood timing for debentures conversion. Good stock to trade but take your profit quickly and find a safer stock to invest in. This one is 100% trade. 1,020,378,291 shares issued up to end of Oct 2019. Up from 400,088,035 just two years ago same time.

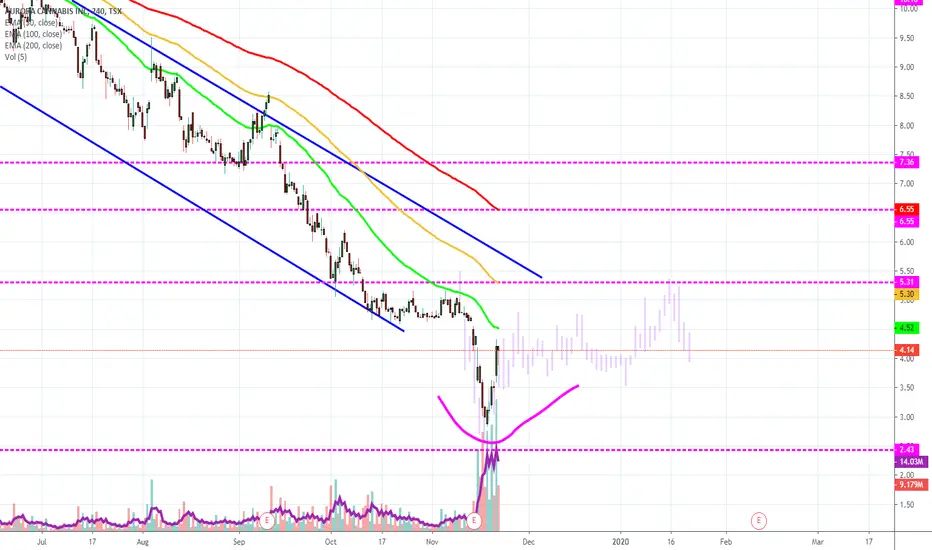
ACB moving towards 5.31After this incredible fall, from 13.52 to 2.80, has now bounced, I can see ACB going sideways and then heading to 5.31. This is about a 28% rise from here.
Cannabis in Free fallAs we looked at this stock yesterday and shorted into the close. It was almost too obvious it would shoot down with the earnings report release. Now there is very little support going into this last downward leg until we reach 2$.
Capitulation mode is in full effect. didn't think it would happen this soon but investors are giving up on cannabis stocks sooner than I expected (this looks really bad for the overall stock market because cannabis is a perfect demonstration of pack psychology and a good measure of impulsivity in the markets). Time to hold shorts until this makes another BIG flat bottom which is characteristic of most bubbles.

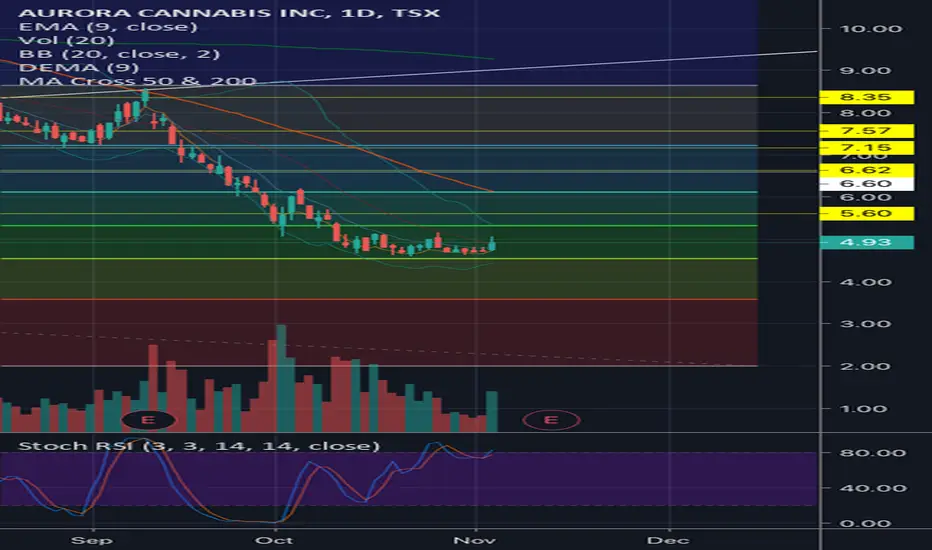
Acb buy Close your shorts on acb. Target price 8.35. Ema cross tomorrow most likely on the daily chart.

ACB at $4.81 looks good, $XLY Auxly and $OGI Organigram better?On a trade, with the strength $WEED is showing off its lows, $ACB at $4.81 CAD looks good for a trade. Still getting a feel for the wider market but might jump in here on continued sector recovery or bull trap.
We have some good chances to test resistance in the $5.10s before setting a new higher low.


Potential rally to $24 in 2020Looks like Aurora Cannabis has formed a 5,3,5 ABC zig zag correction. The C-wave should bottom out around $3.60 area. From there, we should see a motive phase to $24 if the 161.8% fib plays out late 2020.

ACB (Aurora Cannabis Inc) nearing the end of it's Correction After the pot stuck bubble popped we've been stuck in some long complex correction most likely a WXY. If this counts correct we're nearing the end of this correction. It seems everytime ACB makes a major move it first forms bullish divergence on the 6 hour (2 or 3 touches )
I will be waiting for this divergence to form or if we break outta the downward trend line with volume and close above.


capitulation from the cannabis bubbleBack to where it started. will make for a sick buying opportunity. Still short for now

Aurora Cannabis is at 52 week lows ( buying opportunity )Hey,
TSX:ACB
Aurora Cannabis is the best revenue growing company in the cannabis industry, this is a huge company and has a lot more to come with. The reason it has been gone down this much is basiclly because they said they would break the 100 million mark in revenue but got 98.9 million and the shorters saw a huge opportunity on that and took it, however this company is massive and they are deffinetly going to go up. They have two gaps to fill, one is a pretty big gap ALSO the earlier times whenever Aurora has been around this current price it has spiked up and have gone up towards the 14-16 CAD range, you can see that on the 6 months or yearly chart. It also seem to have stabilized after a couple of drops after their quarterly report. In my opinion you could earn some nice money here, you can wait for the indicators to give you a green light but you can also buy at current price because it is close to its 52 week low.
Peace!

Short acb Called the drop from 12 bucks to 8. Found no support at 8 or 7. Sitting currently on the neckline and broken upward trend I will say short to 4 bucks cad. Use a decent stop loss here reversals on the neckline as possible!


Bullish Run if Pattern Repeats ItselfLooks like we might be getting back up to 12 dollar max, if we can push past the $7.80 resistance and get it to act as support


ACB should go upACB is in convergence (RSI)
I do believe conservatively we can expect 8.5 or more but VIX is high. so fingers cross, prepare for long ppl.
