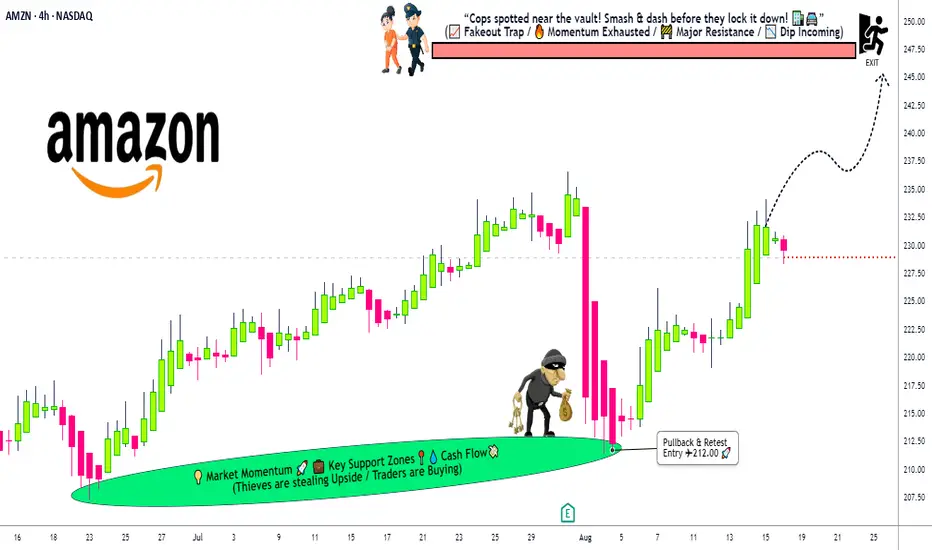
Amazon Stock Heist: Thieves Targeting 247 Escape Point🔐💰 AMAZON HEIST PLAN – STOCK MARKET ROBBERY STYLE 🚀📈
👋 Hey Thief OG’s, Money Grabbers & Market Shadows!
Today’s mission is inside the vault of Amazon.com Inc. (AMZN) – and we’re planning a Bullish Heist.
🎯 ENTRY – Layering the Break-In 💎
The vault doors are always open for the thief gang!
Place mu
Key facts today
Next report date
—
Report period
—
EPS estimate
—
Revenue estimate
—
6.68 USD
59.25 B USD
637.96 B USD
9.66 B
About Amazon.com, Inc.
Sector
Industry
CEO
Andrew R. Jassy
Website
Headquarters
Seattle
Founded
1994
ISIN
US0231351067
FIGI
BBG000BVPV84
Amazon.com, Inc. engages in the provision of online retail shopping services. It operates through the following business segments: North America, International, and Amazon Web Services (AWS). The North America segment includes retail sales of consumer products and subscriptions through North America-focused websites such as amazon.com and amazon.ca. The International segment offers retail sales of consumer products and subscriptions through internationally-focused websites. The Amazon Web Services segment involves in the global sales of compute, storage, database, and AWS service offerings for start-ups, enterprises, government agencies, and academic institutions. The company was founded by Jeffrey P. Bezos in July 1994 and is headquartered in Seattle, WA.
Related stocks
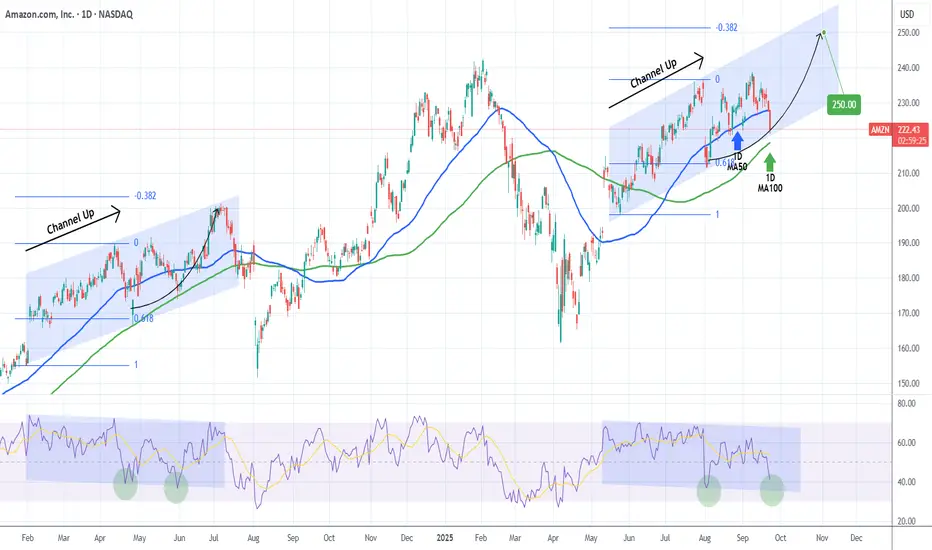
AMAZON Has it found a bottom?Amazon Inc. (AMZN) has been trading within a 4-month Channel Up and is currently pulling back on a Bearish Leg. The 1D MA100 (green trend-line) is just below and last time a similar Channel Up found support on it (May 31 2024), it rebounded for a -0.382 Fibonacci extension top.
As you can see, both
AMAZON FREE SIGNAL|SHORT|
✅AMZN Price rejects supply area with ICT displacement, showing bearish order flow. Liquidity below 217$ becomes the likely draw as inefficiency invites continuation.
—————————
Entry: 220.10$
Stop Loss: 222.00$
Take Profit: 217.00$
Time Frame: 2H
—————————
SHORT🔥
✅Like and subscribe to never mi

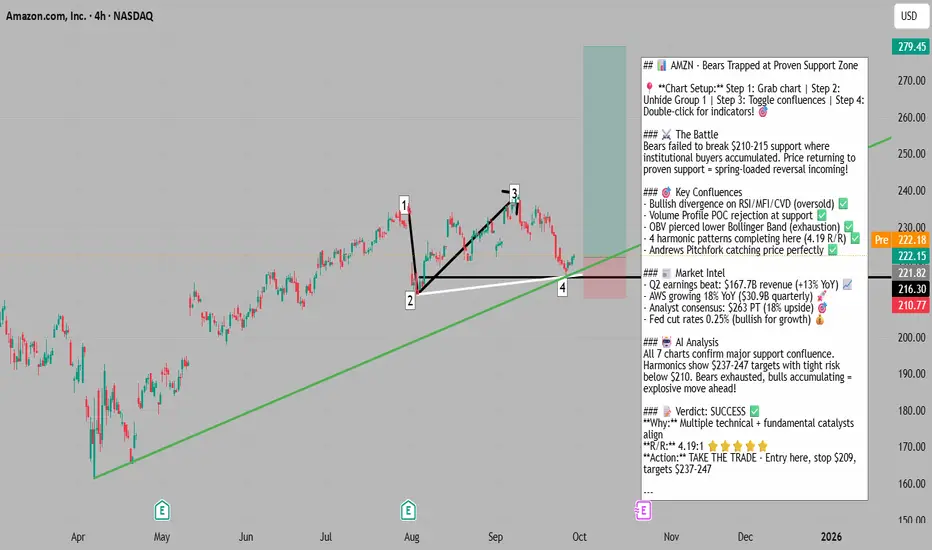
Bears Exhausted at Support - Spring-Loaded Reversal📍 To see my confluences and/or linework: Step 1: Grab chart 📊 Step 2: Unhide Group 1 in object tree 🌳 Step 3: Hide and unhide specific confluences one by one 🔍 Step 4: Double-click the screen to reveal RSI, MFI, CVD, and OBV indicators with divergence markings! 📈
🎯 AMZN: Bears Exhausted at Suppo
AMAZON STOCKS AMAZON stocks pulled out of trend and picked liquidity and back on bullish path, the key drivers for the uptrend will be the following investment into critical infrastructure its building with a strong diversified portfolio in the following
Amazon Web Services (AWS) Growth:
AWS remains Amazon’s la

AMZN: Looking HOT!Watching the reactions to the zone. I will innit ate the position if we land on the support or if my AI system gives me an entry.

Amazon Building Launch Pad - ABC Flat Appears as if this is forming a perfect ABC Flat correction, however tis market is so bull it may start next week from this price, if we can get some seasonal weakness in October hoping it fills the GAP. Leg into longs if it continues to decline.
But interestingly enough, what I have found in th

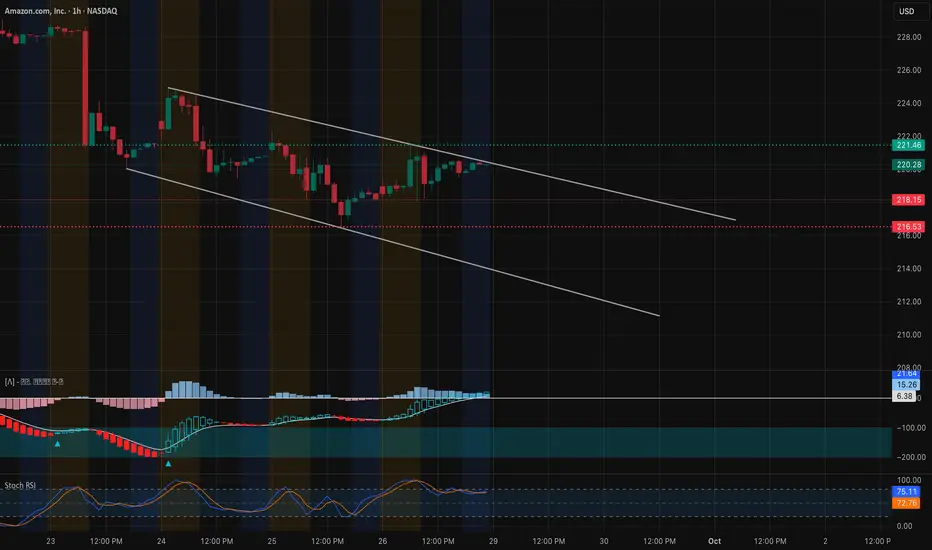
AMZN – Coiling Snap Back as Gamma Signals Set the Range Sep 291-Hour Technical Outlook
Amazon is still moving inside a descending channel that’s been intact for over a week. Price has been repeatedly testing the $217.5–$218 support while carving out slightly higher lows—early signs of a basing attempt. Current price near $220 is rubbing against the channel’s d
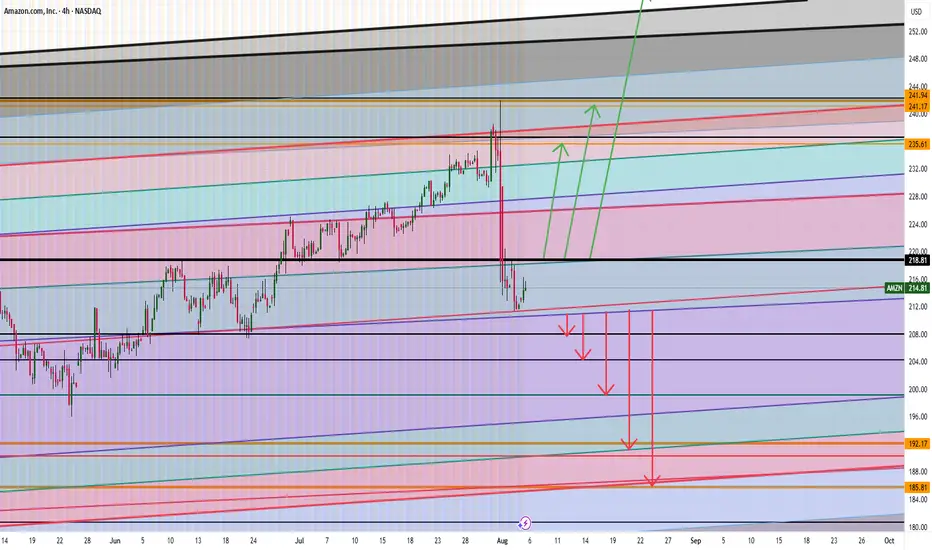
AMAZON ARE WE HEADING TO $258 ? HERE IS THE FULL ANALYSIS Hi Trading fam
So we have Amazon and based on what we are seeing we see two scenarios playing out:
Bullish:
If we can break and hold above 219 then we can see levels of : 235,241,and 258 being hit
Bearish:
If break the low of 210 then we hit 207,204, 199, 190 and then 185
Trade Smarter Li
AMZN Oct. 1 – Testing $220 Pivot, Which Side Breaks First?Intraday View (15-Min Chart)
AMZN sold off sharply and is now consolidating under a descending trendline near $219. Momentum remains bearish, but support around $218–$219 is trying to hold.
* Support Levels: $218.95, $217.93, $216.48
* Resistance Levels: $220.20, $222.54, $224.81
* Indicators: MACD

See all ideas
Summarizing what the indicators are suggesting.
Neutral
SellBuy
Strong sellStrong buy
Strong sellSellNeutralBuyStrong buy
Neutral
SellBuy
Strong sellStrong buy
Strong sellSellNeutralBuyStrong buy
Neutral
SellBuy
Strong sellStrong buy
Strong sellSellNeutralBuyStrong buy
An aggregate view of professional's ratings.
Neutral
SellBuy
Strong sellStrong buy
Strong sellSellNeutralBuyStrong buy
Neutral
SellBuy
Strong sellStrong buy
Strong sellSellNeutralBuyStrong buy
Neutral
SellBuy
Strong sellStrong buy
Strong sellSellNeutralBuyStrong buy
Displays a symbol's price movements over previous years to identify recurring trends.
US23135BT2
Amazon.com, Inc. 2.5% 03-JUN-2050Yield to maturity
5.34%
Maturity date
Jun 3, 2050
US23135CK0
Amazon.com, Inc. 4.1% 13-APR-2062Yield to maturity
5.32%
Maturity date
Apr 13, 2062
US23135CC8
Amazon.com, Inc. 3.25% 12-MAY-2061Yield to maturity
5.31%
Maturity date
May 12, 2061
AMZN4996701
Amazon.com, Inc. 2.7% 03-JUN-2060Yield to maturity
5.30%
Maturity date
Jun 3, 2060
AMZN4531868
Amazon.com, Inc. 4.25% 22-AUG-2057Yield to maturity
5.27%
Maturity date
Aug 22, 2057
US23135CJ3
Amazon.com, Inc. 3.95% 13-APR-2052Yield to maturity
5.27%
Maturity date
Apr 13, 2052
AMZN5182959
Amazon.com, Inc. 3.1% 12-MAY-2051Yield to maturity
5.24%
Maturity date
May 12, 2051
AMZN4531866
Amazon.com, Inc. 4.05% 22-AUG-2047Yield to maturity
5.19%
Maturity date
Aug 22, 2047
AMZN5182958
Amazon.com, Inc. 2.875% 12-MAY-2041Yield to maturity
5.01%
Maturity date
May 12, 2041
US23135AQ9
Amazon.com, Inc. 4.95% 05-DEC-2044Yield to maturity
5.00%
Maturity date
Dec 5, 2044
AMZN4531864
Amazon.com, Inc. 3.875% 22-AUG-2037Yield to maturity
4.69%
Maturity date
Aug 22, 2037
See all AMZN bonds
Curated watchlists where AMZN is featured.


Frequently Asked Questions
The current price of AMZN is 221.93 USD — it has decreased by −1.17% in the past 24 hours. Watch Amazon.com, Inc. stock price performance more closely on the chart.
Depending on the exchange, the stock ticker may vary. For instance, on NASDAQ exchange Amazon.com, Inc. stocks are traded under the ticker AMZN.
AMZN stock has fallen by −3.63% compared to the previous week, the month change is a −5.08% fall, over the last year Amazon.com, Inc. has showed a 20.03% increase.
We've gathered analysts' opinions on Amazon.com, Inc. future price: according to them, AMZN price has a max estimate of 306.00 USD and a min estimate of 230.00 USD. Watch AMZN chart and read a more detailed Amazon.com, Inc. stock forecast: see what analysts think of Amazon.com, Inc. and suggest that you do with its stocks.
AMZN reached its all-time high on Feb 4, 2025 with the price of 242.52 USD, and its all-time low was 0.07 USD and was reached on May 22, 1997. View more price dynamics on AMZN chart.
See other stocks reaching their highest and lowest prices.
See other stocks reaching their highest and lowest prices.
AMZN stock is 2.56% volatile and has beta coefficient of 1.32. Track Amazon.com, Inc. stock price on the chart and check out the list of the most volatile stocks — is Amazon.com, Inc. there?
Today Amazon.com, Inc. has the market capitalization of 2.34 T, it has decreased by −0.29% over the last week.
Yes, you can track Amazon.com, Inc. financials in yearly and quarterly reports right on TradingView.
Amazon.com, Inc. is going to release the next earnings report on Oct 23, 2025. Keep track of upcoming events with our Earnings Calendar.
AMZN earnings for the last quarter are 1.68 USD per share, whereas the estimation was 1.33 USD resulting in a 26.44% surprise. The estimated earnings for the next quarter are 1.56 USD per share. See more details about Amazon.com, Inc. earnings.
Amazon.com, Inc. revenue for the last quarter amounts to 167.70 B USD, despite the estimated figure of 162.43 B USD. In the next quarter, revenue is expected to reach 177.73 B USD.
AMZN net income for the last quarter is 18.16 B USD, while the quarter before that showed 17.13 B USD of net income which accounts for 6.05% change. Track more Amazon.com, Inc. financial stats to get the full picture.
No, AMZN doesn't pay any dividends to its shareholders. But don't worry, we've prepared a list of high-dividend stocks for you.
As of Oct 1, 2025, the company has 1.56 M employees. See our rating of the largest employees — is Amazon.com, Inc. on this list?
EBITDA measures a company's operating performance, its growth signifies an improvement in the efficiency of a company. Amazon.com, Inc. EBITDA is 135.70 B USD, and current EBITDA margin is 19.15%. See more stats in Amazon.com, Inc. financial statements.
Like other stocks, AMZN shares are traded on stock exchanges, e.g. Nasdaq, Nyse, Euronext, and the easiest way to buy them is through an online stock broker. To do this, you need to open an account and follow a broker's procedures, then start trading. You can trade Amazon.com, Inc. stock right from TradingView charts — choose your broker and connect to your account.
Investing in stocks requires a comprehensive research: you should carefully study all the available data, e.g. company's financials, related news, and its technical analysis. So Amazon.com, Inc. technincal analysis shows the sell today, and its 1 week rating is buy. Since market conditions are prone to changes, it's worth looking a bit further into the future — according to the 1 month rating Amazon.com, Inc. stock shows the buy signal. See more of Amazon.com, Inc. technicals for a more comprehensive analysis.
If you're still not sure, try looking for inspiration in our curated watchlists.
If you're still not sure, try looking for inspiration in our curated watchlists.