CSBR Trade Setup: Entry, Targets, and Stop Loss Explained!
Stop Loss (SL): $8.84 (white line, key support level).
Entry: Around $9.52 (yellow line, breakout area).
Target 1 (T1): $10.26 (red line, conservative target).
Target 2 (T2): $11.40 (green line, aggressive target).
#StockMarket #Trading #DayTrading #SwingTrading #TechnicalAnalysis #CSBR #CSBRSt
Champions Oncology, Inc.
6.52USDR
−0.32−4.68%
At close at Aug 14, 20:00 GMT
USD
No trades
Next report date
≈
September 10
Report period
Q1 2025
EPS estimate
−0.01 USD
Revenue estimate
13.51 M USD
0.34 USD
4.70 M USD
56.94 M USD
6.10 M
About Champions Oncology, Inc.
Sector
Industry
CEO
Ronnie Morris
Website
Headquarters
Hackensack
Founded
1985
FIGI
BBG000BYGPJ9
Champions Oncology, Inc. engages in the development and sale of technology solutions and products to personalize the development and use of oncology drugs. Its technology platform, TumorGraft, is a novel approach to personalizing cancer care based upon the implantation of human tumors in immune-deficient mice. The company was founded by James M. Martell and David Sidransky on June 4, 1985 and is headquartered in Hackensack, NJ.
−30%
−15%
0%
15%
30%
Q4 '23
Q1 '24
Q2 '24
Q3 '24
Q4 '24
−6.00 M
0.00
6.00 M
12.00 M
18.00 M
Revenue
Net income
Net margin %
Revenue
COGS
Gross profit
Op expenses
Op income
Non-Op income/ expenses
Taxes & Other
Net income
−4.50 M
0.00
4.50 M
9.00 M
13.50 M
Revenue
COGS
Gross profit
Expenses & adjustments
Net income
−4.50 M
0.00
4.50 M
9.00 M
13.50 M
Q4 '23
Q1 '24
Q2 '24
Q3 '24
Q4 '24
−3.50 M
0.00
3.50 M
7.00 M
10.50 M
Debt
Free cash flow
Cash & equivalents
No news here
Looks like there's nothing to report right now


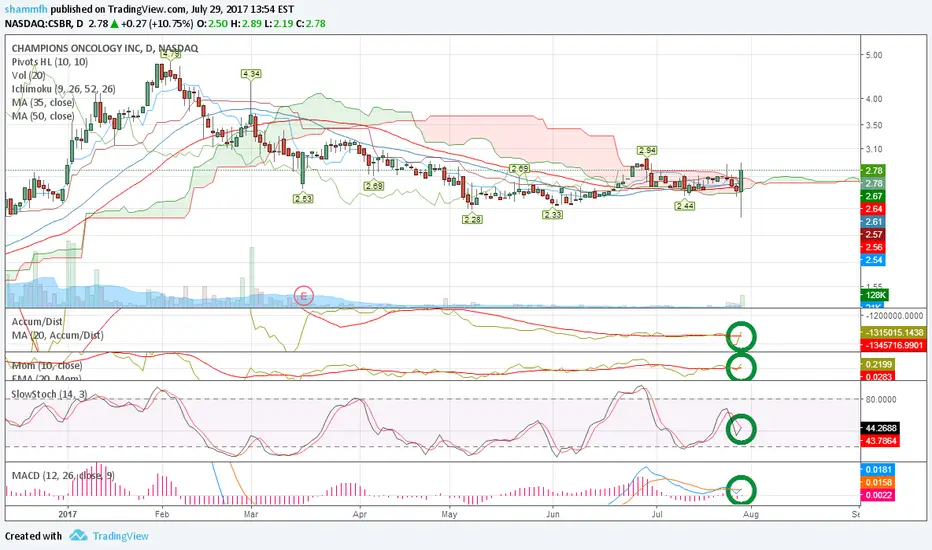
CSBRChampions Oncology Inc. (CSBR) develops novel technologies for oncology diagnosis and treatment. It topped out at $23.88 in 2013 and entered a decline that posted an all-time low at $1.11 in August 2016. A basing pattern into November got bought, lifting the stock into a recovery wave that broke out

See all ideas
Summarizing what the indicators are suggesting.
Neutral
SellBuy
Strong sellStrong buy
Strong sellSellNeutralBuyStrong buy
Neutral
SellBuy
Strong sellStrong buy
Strong sellSellNeutralBuyStrong buy
Neutral
SellBuy
Strong sellStrong buy
Strong sellSellNeutralBuyStrong buy
An aggregate view of professional's ratings.
Neutral
SellBuy
Strong sellStrong buy
Strong sellSellNeutralBuyStrong buy
Neutral
SellBuy
Strong sellStrong buy
Strong sellSellNeutralBuyStrong buy
Neutral
SellBuy
Strong sellStrong buy
Strong sellSellNeutralBuyStrong buy
Displays a symbol's price movements over previous years to identify recurring trends.
Curated watchlists where CSBR is featured.

Frequently Asked Questions
The current price of CSBR is 6.52 USD — it has decreased by −4.68% in the past 24 hours. Watch Champions Oncology, Inc. stock price performance more closely on the chart.
Depending on the exchange, the stock ticker may vary. For instance, on NASDAQ exchange Champions Oncology, Inc. stocks are traded under the ticker CSBR.
CSBR stock has risen by 5.23% compared to the previous week, the month change is a −14.82% fall, over the last year Champions Oncology, Inc. has showed a 45.86% increase.
We've gathered analysts' opinions on Champions Oncology, Inc. future price: according to them, CSBR price has a max estimate of 12.00 USD and a min estimate of 12.00 USD. Watch CSBR chart and read a more detailed Champions Oncology, Inc. stock forecast: see what analysts think of Champions Oncology, Inc. and suggest that you do with its stocks.
CSBR reached its all-time high on Oct 1, 2018 with the price of 17.90 USD, and its all-time low was 1.11 USD and was reached on Aug 26, 2016. View more price dynamics on CSBR chart.
See other stocks reaching their highest and lowest prices.
See other stocks reaching their highest and lowest prices.
CSBR stock is 5.06% volatile and has beta coefficient of 0.56. Track Champions Oncology, Inc. stock price on the chart and check out the list of the most volatile stocks — is Champions Oncology, Inc. there?
Today Champions Oncology, Inc. has the market capitalization of 94.24 M, it has decreased by −0.81% over the last week.
Yes, you can track Champions Oncology, Inc. financials in yearly and quarterly reports right on TradingView.
Champions Oncology, Inc. is going to release the next earnings report on Sep 10, 2025. Keep track of upcoming events with our Earnings Calendar.
CSBR earnings for the last quarter are −0.07 USD per share, whereas the estimation was −0.20 USD resulting in a 65.00% surprise. The estimated earnings for the next quarter are −0.01 USD per share. See more details about Champions Oncology, Inc. earnings.
Champions Oncology, Inc. revenue for the last quarter amounts to 12.36 M USD, despite the estimated figure of 12.00 M USD. In the next quarter, revenue is expected to reach 13.51 M USD.
CSBR net income for the last quarter is −1.83 M USD, while the quarter before that showed 4.50 M USD of net income which accounts for −140.82% change. Track more Champions Oncology, Inc. financial stats to get the full picture.
No, CSBR doesn't pay any dividends to its shareholders. But don't worry, we've prepared a list of high-dividend stocks for you.
As of Aug 15, 2025, the company has 213 employees. See our rating of the largest employees — is Champions Oncology, Inc. on this list?
EBITDA measures a company's operating performance, its growth signifies an improvement in the efficiency of a company. Champions Oncology, Inc. EBITDA is 6.49 M USD, and current EBITDA margin is 11.39%. See more stats in Champions Oncology, Inc. financial statements.
Like other stocks, CSBR shares are traded on stock exchanges, e.g. Nasdaq, Nyse, Euronext, and the easiest way to buy them is through an online stock broker. To do this, you need to open an account and follow a broker's procedures, then start trading. You can trade Champions Oncology, Inc. stock right from TradingView charts — choose your broker and connect to your account.
Investing in stocks requires a comprehensive research: you should carefully study all the available data, e.g. company's financials, related news, and its technical analysis. So Champions Oncology, Inc. technincal analysis shows the sell today, and its 1 week rating is sell. Since market conditions are prone to changes, it's worth looking a bit further into the future — according to the 1 month rating Champions Oncology, Inc. stock shows the neutral signal. See more of Champions Oncology, Inc. technicals for a more comprehensive analysis.
If you're still not sure, try looking for inspiration in our curated watchlists.
If you're still not sure, try looking for inspiration in our curated watchlists.