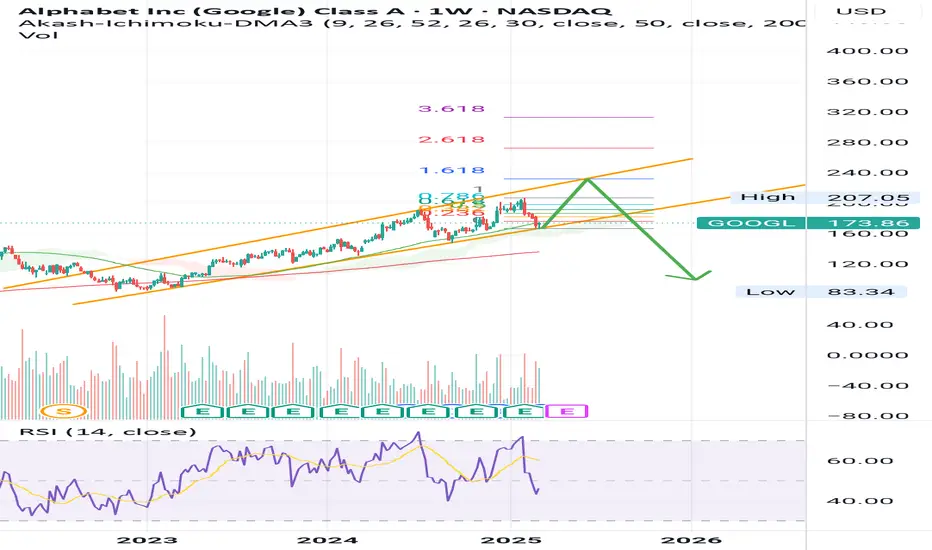
GOOGL - Melt up & Crash series [1] GOOGL has a date with the top rail around very late may or early June in my opinion.
Again it has already touched the green ichimoku cloud once, it only needs to complete the channel.
Not financial advice.
GOOG trade ideas
GOOGLE Stock Chart Fibonacci Analysys 030825Trading Idea
1) Find a FIBO slingshot
2) Check FIBO 61.80% level
3) Entry Point > 170/61.80%
Chart time frame: B
A) 15 min(1W-3M)
B) 1 hr(3M-6M)
C) 4 hr(6M-1year)
D) 1 day(1-3years)
Stock progress: A
A) Keep rising over 61.80% resistance
B) 61.80% resistance
C) 61.80% support
D) Hit the bottom
E) Hit the top
Stocks rise as they rise from support and fall from resistance. Our goal is to find a low support point and enter. It can be referred to as buying at the pullback point. The pullback point can be found with a Fibonacci extension of 61.80%. This is a step to find entry level. 1) Find a triangle (Fibonacci Speed Fan Line) that connects the high (resistance) and low (support) points of the stock in progress, where it is continuously expressed as a Slingshot, 2) and create a Fibonacci extension level for the first rising wave from the start point of slingshot pattern.
When the current price goes over 61.80% level , that can be a good entry point, especially if the SMA 100 and 200 curves are gathered together at 61.80%, it is a very good entry point.
As a great help, tradingview provides these Fibonacci speed fan lines and extension levels with ease. So if you use the Fibonacci fan line, the extension level, and the SMA 100/200 curve well, you can find an entry point for the stock market. At least you have to enter at this low point to avoid trading failure, and if you are skilled at entering this low point, with fibonacci6180 technique, your reading skill to chart will be greatly improved.
If you want to do day trading, please set the time frame to 5 minutes or 15 minutes, and you will see many of the low point of rising stocks.
If want to prefer long term range trading, you can set the time frame to 1 hr or 1 day.


Google (Alphabet) is at a critical levelGoogle just touched POC of 2024 based on Volume profile as well as a long term trend line.
It is a screaming buy on its own. If POC level is broken then it would mean market is going in deeper correction. For now I think it is bullish unless macro economics confirms R

GOOGLE Stock Chart Fibonacci Analysis 030625Trading Idea
1) Find a FIBO slingshot
2) Check FIBO 61.80% level
3) Entry Point > 180/61.80%
Chart time frame: B
A) 15 min(1W-3M)
B) 1 hr(3M-6M)
C) 4 hr(6M-1year)
D) 1 day(1-3years)
Stock progress: B
A) Keep rising over 61.80% resistance
B) 61.80% resistance
C) 61.80% support
D) Hit the bottom
E) Hit the top
Stocks rise as they rise from support and fall from resistance. Our goal is to find a low support point and enter. It can be referred to as buying at the pullback point. The pullback point can be found with a Fibonacci extension of 61.80%. This is a step to find entry level. 1) Find a triangle (Fibonacci Speed Fan Line) that connects the high (resistance) and low (support) points of the stock in progress, where it is continuously expressed as a Slingshot, 2) and create a Fibonacci extension level for the first rising wave from the start point of slingshot pattern.
When the current price goes over 61.80% level , that can be a good entry point, especially if the SMA 100 and 200 curves are gathered together at 61.80%, it is a very good entry point.
As a great help, tradingview provides these Fibonacci speed fan lines and extension levels with ease. So if you use the Fibonacci fan line, the extension level, and the SMA 100/200 curve well, you can find an entry point for the stock market. At least you have to enter at this low point to avoid trading failure, and if you are skilled at entering this low point, with fibonacci6180 technique, your reading skill to chart will be greatly improved.
If you want to do day trading, please set the time frame to 5 minutes or 15 minutes, and you will see many of the low point of rising stocks.
If want to prefer long term range trading, you can set the time frame to 1 hr or 1 day.


What Is Market Capitulation, and How Can You Trade It?What Is Market Capitulation, and How Can You Trade It?
Market capitulation occurs when investors collectively surrender to market fears, leading to a sharp decline in asset prices. This article delves into the mechanics of capitulation, how to identify it, and ways to trade effectively during these tumultuous times.
Understanding Market Capitulation
Market capitulation refers to a phenomenon where a large number of investors simultaneously give up on the market, leading to a rapid and substantial decline in asset prices. This mass surrender is driven primarily by panic and fear of further losses. Capitulation often marks the peak of a bearish trend and is typically characterised by a significant spike in trading volumes and sharp price declines.
Stock capitulation occurs when investors, overwhelmed by fear and uncertainty, rush to sell their assets to avoid further losses. This behaviour is often triggered by prolonged market downturns or significant economic events. For instance, during the COVID-19 pandemic in March 2020, the S&P 500 experienced a nearly 5% drop in a single day, a classic example of market capitulation. This event led to a subsequent 17% rebound in the index over the following week, highlighting how capitulation can precede a market turnaround.
Psychologically, capitulation represents the point where investor sentiment shifts from hope to despair. The collective mindset of "cutting losses" leads to a cascade of selling pressure, pushing prices to extreme lows. The intensity of selling can be so severe that it wipes out significant market value in a very short period.
While capitulation can be daunting, it also presents opportunities. For contrarian investors and traders, these periods of panic selling can offer attractive entry points. As prices plummet, fundamentally strong assets may become undervalued, providing a chance to buy at lower prices. However, caution is essential as markets can remain volatile, and further declines are possible before a sustained recovery takes hold.
Identifying Market Capitulation
Identifying market capitulation involves recognising several key indicators that signify a dramatic surge in selling pressure and a sharp decline in asset prices. Here are the most notable indications to look for:
Steep Price Decline
Capitulation is typically associated with a rapid and substantial drop in asset prices. This sharp decline occurs as panic selling accelerates, pushing prices down swiftly, often with large candles and minimal wicks.
High Trading Volume
During capitulation, there is often a significant spike in trading volume as investors rush to sell their holdings. This increase in volume is a key signal that a large number of market participants are exiting their positions simultaneously.
Extreme Bearish Sentiment
Market sentiment during capitulation is overwhelmingly negative. News and investor sentiment indicators turn highly pessimistic, contributing to the panic and further driving down prices.
Technical Indicators
Various technical analysis tools can help identify capitulation:
- Volume Oscillator and On-Balance Volume (OBV): These indicators track changes in volume and can signal when selling pressure is peaking. A sharp decrease in these indicators often accompanies capitulation.
- Candlestick Patterns: Patterns like the hammer candlestick, which shows a recovery from intraday lows, and other patterns like the three white soldiers, can indicate that the market may have reached a bottom. The presence of such patterns, especially when accompanied by high volume, suggests a potential reversal.
- Bollinger Bands: These bands plot 2 standard deviations above and below a moving average. During capitulation, prices often touch or fall below the lower band, which indicates extreme selling conditions and potential oversold levels. This is especially true if the price falls beyond 3 standard deviations.
- Average True Range (ATR): The ATR is an indicator that’s used to measure market volatility. A sudden, sharp increase in ATR during a downtrend can signal capitulation as it reflects the heightened panic and large price movements typical of such periods.
Exhaustion of Selling
Capitulation often marks the point where selling pressure exhausts. This occurs when most investors who intend to sell have done so, leaving fewer sellers in the market. This depletion of sellers can indicate that a bottom is near and that a reversal may be imminent.
The Impact of Market Capitulation on Markets
Market capitulation has significant effects on financial markets, influencing both short-term and long-term trends.
Short-Term Impact
Immediately following capitulation, markets often experience extreme volatility and uncertainty. The intense selling pressure often drives asset prices sharply lower, causing values to drop significantly below their intrinsic worth.
This phase is characterised by wild price swings as the market seeks a new equilibrium. The pervasive negative sentiment and widespread fear can further exacerbate the situation; across a broader downward move, there can be multiple points of capitulation with high volatility surrounding these additional selloffs.
Long-Term Implications
Over the long term, capitulation often marks the bottom of a market downturn. As the selling pressure diminishes and fewer investors remain to sell, the market begins to stabilise. This stabilisation allows new investors to enter the market, often leading to a gradual recovery in asset prices.
However, it is essential to recognise that not every capitulation results in an immediate market reversal. Some markets may continue to decline or consolidate before a sustained recovery takes hold, with these new investors falling prey to the same fear-driven trading as another potential capitulation occurs.
Psychological and Sentimental Effects
Capitulation also has a lasting impact on investor sentiment. The severe downturn and associated losses can create a long-term negative perception of the affected assets, causing investors to remain cautious even after the market begins to recover. This psychological impact can lead to reduced trading volumes and prolonged periods of low investor confidence.
How to Trade Around a Market Capitulation Event
Trading around a market capitulation event can be challenging due to the difficulty in accurately identifying capitulation in real-time. Capitulation often becomes clear only in hindsight, which complicates the process of trading or anticipating it effectively.
Avoiding the Falling Knife
After identifying potential capitulation—characterised by a sharp price drop, likely on increased volume, and backed by extreme bearish sentiment—,it's typically unwise to try and buy during the initial plunge. The sharp decline often leads to further drops, even if they are less severe. Trying to "catch the falling knife" can potentially result in further losses as prices continue to fall.
Taking a Short Position During a Dead Cat Bounce
One of traders’ approaches is to take a short position during a "dead cat bounce" or brief pullback before another downward leg. However, this strategy carries a less favourable risk/reward ratio because it involves selling low with the intention of selling lower. This might be effective but requires precise timing and strong risk management.
Waiting for Stability
The most prudent strategy is often to wait until market volatility subsides and a bottom appears to form. Signs of a market bottom include the price overcoming a previous swing high or breaking through a prior level of resistance. This indicates a potential shift in market sentiment, offering the trader an opportunity to buy low and sell high with a much more favourable risk-reward profile.
Using Confluence in Analysis
Combining different forms of analysis can provide greater confidence in identifying a market bottom. For example, if prices fall to a key support level or the decline seems disproportionately sharp compared to fundamentals, it might indicate an oversold condition. Momentum indicators and moving averages can also help confirm potential reversal points.
Risk Management
Strong risk management practices are crucial. Limiting position sizes and always adhering to a stop loss can potentially prevent severe losses if the market experiences another leg down. This means that traders can potentially protect themselves against unexpected volatility and further declines.
Common Mistakes Traders Make During Market Capitulation
Navigating market capitulation is challenging due to the extreme volatility and widespread panic that characterise these events. Here are some specific mistakes that traders frequently make during market capitulation:
Panic Selling
One of the most common mistakes is succumbing to panic and selling off assets hastily. During capitulation, the market is driven by extreme fear, and many traders sell to avoid further losses. This emotional response can lead to selling at the lowest point, locking in significant losses and missing out on potential rebounds once the market stabilises.
Holding onto Losing Positions
Traders often make the mistake of holding onto a losing position, hoping for a reversal. When a trader holds a long position and witnesses market capitulation, the instinct might be to wait for the market to recover. However, this can lead to further losses as the asset's value continues to decline. Instead of cutting losses early, some traders let the losses accumulate, which can deplete their capital and limit future trading opportunities.
This contradicts the previous point, and you may be confused about whether you sell or hold onto the trade. In any case, you will face a decision to either sell or hold on to their position if the capitulation is severe and protracted. It will always depend on the context and fundamental reason behind the capitulation, it’s worth noting that stocks generally recover over time.
Trying to Time the Bottom
Attempting to time the market bottom during capitulation is exceedingly difficult and can easily lead to additional losses. Capitulation typically involves sharp price declines and increased volatility, making it challenging to determine the exact bottom. Traders who try to catch the falling knife may find themselves buying into a market that continues to drop.
Overexposing Positions
Another mistake is overexposing oneself to high-risk positions during periods of extreme market volatility. Instead of taking bolder positions, traders are best served to limit their exposure with smaller positions, stop losses, a diversified portfolio, and more judicious entries. It's essential to maintain a balanced approach and avoid putting too much capital into volatile trades.
The Bottom Line
Understanding and navigating market capitulation can be challenging but offers potential opportunities for informed traders. By recognising key indicators and avoiding common mistakes, traders can better manage their strategies during these volatile periods. For a robust trading experience, consider opening an account with FXOpen to leverage these insights and trade with a broker you can trust.
FAQs
What Is Capitulation in the Stock Market?
The capitulation meaning in the stock market refers to the moment when investors and traders, overwhelmed by fear and panic due to a prolonged decline in stock prices, decide to sell their holdings at any price to stop further losses. This mass selling leads to a sharp and rapid drop in stock prices. The term is derived from the military concept of surrender, indicating that investors are giving up on their positions.
Is Capitulation Bullish or Bearish?
Capitulation is both bullish and bearish. It is bearish during the actual event, as it involves widespread panic selling and a significant drop in stock prices. However, it can be bullish afterward, as it often marks the end of a severe downtrend and the beginning of a recovery or rally. This is because the selling pressure is exhausted, and buyers start to step in, finding attractive entry points.
How Does Capitulation Work?
Capitulation works through a cycle of fear and panic. Initially, as prices decline, some investors start selling to cut their losses. This selling pressure causes prices to drop further, leading more investors to panic and sell their holdings. This cycle continues until the majority of investors have sold their positions, leading to a sharp decline in prices. Eventually, the market stabilises as the selling pressure diminishes, often followed by a recovery.
What Are Signs of Capitulation?
Signs of capitulation include a sharp decline in prices, high trading volumes, extreme bearish sentiment, and market exhaustion, where selling pressure diminishes, stabilising the market.
What Is Capitulation in Crypto*?
Capitulation in the cryptocurrency market* follows a similar pattern to that in the stock market. It occurs when crypto* investors, driven by fear and panic due to a prolonged decline in prices, sell their holdings en masse, leading to a sharp drop in prices. This can be triggered by negative news, regulatory actions, or broader market downturns.
*Important: At FXOpen UK, Cryptocurrency trading via CFDs is only available to our Professional clients. They are not available for trading by Retail clients. To find out more information about how this may affect you, please get in touch with our team.
Trade on TradingView with FXOpen. Consider opening an account and access over 700 markets with tight spreads from 0.0 pips and low commissions from $1.50 per lot.
This article represents the opinion of the Companies operating under the FXOpen brand only. It is not to be construed as an offer, solicitation, or recommendation with respect to products and services provided by the Companies operating under the FXOpen brand, nor is it to be considered financial advice.

Googles next Move where to Long next + Wickless Candles Hi in this video I highlight what to look for in the chart to take shorts and where to fill Longs next . In addition to that I provide a small educational idea of looking out for Wickless candles and how they can add value to your analysis . Please like follow share and ask any questions that you have and thankyou for your support

Google Update - Trade this range and new ATH Identified Update video on the google Long that has been planned since early FEB. The level has now been hit and we got a nice reaction off that level . In this video I look into where I think we go next and how price plays out .
In the video I use the following tools TR Pocket FIB , 0.618 FIB , Pivots , Parallel Channel and the Fixed range Vol Profile.
If we stay range bound inside the channel then we have the potential to see a new high on google at the top of the channel in confluence with 1-1 ext + tr pocket expansion .
Watch the video and mark the levels on your chart and ensure to set your alerts .
Dont forget to Boost the chart Please and i welcome any questions TY

Analysis of Alphabet Inc (Google) Class C Stock (GOOG)The chart provided is a daily candlestick chart of Alphabet Inc (Google) Class C stock (GOOG) on the NASDAQ, spanning from early 2024 to March 5, 2025. The stock price as of March 5, 2025, is $172.61, down $3.95 (-2.34%) from the previous day. Let’s break down the chart and analyze the price action, trends, and potential future movements.
1. Price Action and Trend Analysis
Early 2024 to Mid-2024 (April to July): The stock started around $140 and showed a strong uptrend, reaching a peak of around $192 by mid-July. This period reflects bullish momentum, likely driven by positive market sentiment, strong earnings, or favorable macroeconomic conditions for tech stocks.
Mid-2024 Correction (July to August): After hitting $192, the stock experienced a sharp correction, dropping to around $165 by early August. This pullback could be attributed to profit-taking, broader market volatility, or specific news affecting Alphabet or the tech sector.
Recovery and Second Peak (August to November): From August onwards, the stock regained momentum, climbing steadily and reaching a new all-time high of approximately $205 by late November. This indicates renewed investor confidence and a continuation of the bullish trend.
Recent Decline (December 2024 to March 2025): Since hitting $205, the stock has been in a downtrend, dropping to $172.61 by March 5, 2025. This decline of about 16% from the peak suggests a bearish phase, possibly due to market-wide corrections, profit-taking, or negative developments affecting Alphabet (e.g., regulatory concerns, weaker earnings outlook, or macroeconomic factors like rising interest rates).
2. Key Levels and Support/Resistance
Support Levels:
The $165 level acted as support during the August correction. This could be a potential area where buyers might step in if the stock continues to decline.
A stronger historical support lies around $150, seen in early 2024 before the uptrend began.
Resistance Levels:
The recent high of $205 is a key resistance level. For the stock to resume a bullish trend, it would need to break above this level with strong volume.
The $192 level (the previous peak in July) may also act as intermediate resistance if the stock attempts a recovery.
3. Trend and Momentum
The current trend is bearish, as the stock has been making lower highs and lower lows since December 2024.
The magnitude of the recent drop (from $205 to $172.61) indicates strong selling pressure. The lack of significant bounces during this decline suggests that bearish sentiment dominates in the short term.
Momentum appears to be slowing on the downside, as the stock has not yet reached the $165 support level, but there are no clear signs of a reversal yet.
4. Volume and Market Sentiment
The chart does not display volume, but typically, a decline like this would be accompanied by higher selling volume. If the volume has been decreasing during the recent drop, it might indicate that selling pressure is waning, which could lead to a potential bounce.
Alphabet, as a major tech stock, is often influenced by broader market trends. The recent decline could be tied to macroeconomic factors (e.g., fears of a recession, inflation concerns, or shifts in investor preference away from growth stocks).
5. Projection and Recommendation
Based on the current chart, here’s a projection for Alphabet’s stock price in the near term:
Bearish Scenario (Short-Term Continuation of Downtrend):
If the stock fails to hold above $172 and breaks below $170, it could test the $165 support level. A further break below $165 might lead to a deeper correction towards $150, a significant psychological and historical support level.
This scenario is more likely if broader market conditions remain unfavorable or if Alphabet faces negative news (e.g., regulatory fines, weaker-than-expected earnings).
Bullish Scenario (Potential Reversal):
If the stock holds above $170 and shows signs of a reversal (e.g., a strong bullish candlestick pattern like a hammer or engulfing pattern, accompanied by high volume), it could signal the start of a recovery.
The first target for a recovery would be $192 (the previous high), followed by $205. A break above $205 would confirm a resumption of the long-term uptrend.
6. Position Recommendation: Long or Short?
Short-Term (1-3 Months): Given the current downtrend and lack of clear reversal signals, a short position may be more appropriate for traders looking to capitalize on further downside. A stop-loss could be placed above $180 to manage risk in case of an unexpected reversal. The target for a short position would be $165 or $150, depending on the momentum of the decline.
Long-Term (6-12 Months): Alphabet remains a fundamentally strong company with a dominant position in search, cloud, and AI. If the stock reaches the $165 support level and shows signs of stabilization (e.g., higher lows, increased buying volume), it could be a good opportunity for a long position for long-term investors. A stop-loss below $165 would help manage risk, with a target of $192 or higher.
7. Risks to Consider
Macro Risks: Tech stocks like Alphabet are sensitive to interest rate changes, inflation, and economic slowdowns. If these factors worsen, the stock could face more downside pressure.
Company-Specific Risks: Alphabet has faced regulatory scrutiny over its business practices (e.g., antitrust lawsuits). Any adverse developments on this front could negatively impact the stock.
Market Sentiment: A broader market rally could lift Alphabet’s stock, even in the absence of company-specific catalysts. Conversely, a market sell-off could exacerbate the current decline.
Conclusion
The chart indicates that Alphabet’s stock is currently in a bearish phase after a strong run-up in 2024. For short-term traders, a short position may offer better opportunities given the ongoing downtrend, with a target of $165 or $150. However, long-term investors might find value in waiting for a potential bottom around $165 before entering a long position, especially if the stock shows signs of stabilization. As always, consider using proper risk management techniques, such as stop-loss orders, and monitor broader market conditions and company-specific news for a more informed decision.


Bull/ Bear case for GOOGLE
Key Resistance Levels: $175.58, $183.04, $192.81
Key Support Levels: $168.66, $160.51, $151.55
Bull Case
Channel Support Holding: The stock is currently testing the lower trendline of a rising channel, a potential reversal point.The stock has historical demand near $168, which could act as a base for a rebound.
If GOOG holds above $168.66, a bounce toward $175.58 and $183.04 is possible.
Bear Case
The stock is trading below key moving averages, showing bearish momentum.
GOOG has failed to break recent highs and is forming a descending pattern, suggesting continued weakness.
Break of $168.66 Could Accelerate Decline: If the stock closes below $168.66, it may drop toward $160.51, with further downside to $151.55.
Which Side is GOOG Leaning Toward?
Short-Term: Slightly Bearish – The price action suggests downward momentum, but a potential bounce is possible.
Medium-Term: Bearish – Lower highs and weak momentum indicate further downside risk.
Long-Term: Bullish – The stock remains within a rising channel, but it needs to hold support at $168-$160.
Trading Strategy
Bulls: Look for a bounce near $168.66 with a stop loss at $164.38, targeting $175–$183.
Bears: Short on breakdown below $168 with a target of $160–$151.

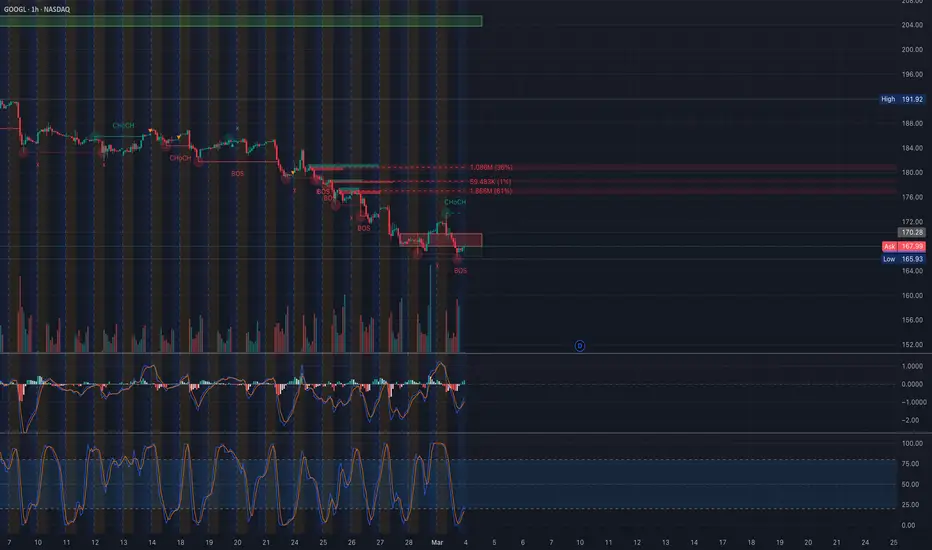
Google (GOOGL) Approaching a Make-or-Break Level!📊 Technical Analysis (TA):
1. Trend & Structure:
* GOOGL remains in a strong downtrend, confirmed by multiple Break of Structure (BOS) signals.
* A recent Change of Character (ChoCH) attempt suggests a possible reversal, but confirmation is needed.
* Key Resistance: ~177-180 (supply zone)
* Support Zone: ~165-167 (high liquidity demand area)
2. Indicators Suggesting a Possible Reversal:
* MACD: Momentum is starting to slow down, and a potential bullish crossover may be forming.
* Stochastic RSI: Oversold conditions suggest a possible short-term bounce.
* Volume Spike: Strong buying volume appearing near support levels indicates institutional interest.
🔹 GEX & Options Flow:
1. Call Walls (Resistance) 🚧
* 177-190: Major resistance levels, likely to reject price on any bounce.
* 200: 3rd Call Wall, where gamma resistance is strong.
2. Put Walls (Support) 🛑
* 160: Highest negative NETGEX, meaning a break below could accelerate a sharp drop.
* 155-150: Next downside targets if 160 fails.
3. IV Rank & Skew:
* IVR 50.5, indicating mid-range volatility.
* IV skew suggests a neutral to slightly bearish bias.
* Calls only 3.2%, confirming put dominance.
📌 Trading Plan & Suggestions:
* Bullish Reversal Scenario:
* If GOOGL holds 165-167, we could see a bounce toward 175-180.
* Ideal trade: March-April 170C or 175C, targeting a reversal.
* Bearish Breakdown Scenario:
* If GOOGL breaks 165, expect a drop toward 160, triggering put-heavy action.
* Ideal Put Play: Buy March-April 165P or 160P targeting 150-160.
⚠️ Key Warning: The next few candles will be critical—watch for bullish confirmation before going long.
🔥 Conclusion: GOOGL Near a Reversal Zone – Watch for Confirmation!
Google is testing a key support area, with indicators showing early signs of a bounce. However, if 165 fails, we could see a sharp drop toward 160-155. The next sessions will determine the trend—stay alert for reversals or breakdowns! 🚀📉
🚨 Disclaimer:
This analysis is for educational purposes only and does not constitute financial advice. Always do your own research and trade responsibly.
Alphabet Inc. (GOOGL) – Bullish Reversal Opportunity📉 Google stock has corrected ~16.9% from its $207 high last month, now testing a strong trendline support.
With bullish RSI divergence and major AI investments ahead, this could be a prime buy-the-dip opportunity!
📊 Trade Setup:
🔹 Entry Price: $171.80 (Current Price)
✅ Take Profit 1: $190 (Short-term resistance)
✅ Take Profit 2: $207 (Previous high)
✅ Take Profit 3: $220+ (Analyst average price target)
🔹 Stop-Loss: $165 (Below trendline)
🔹 RSI: Bullish divergence – signaling potential upside momentum
📈 Why Google?
AI & Cloud Expansion – $59B AI revenue expected by 2028 (Morgan Stanley)
Waymo Growth – Autonomous vehicle expansion into Miami (2026)
YouTube & Digital Ads – Performance Max driving revenue gains
Strong Cloud Business – Competing with AWS & Microsoft Azure
🔹 Analyst Insights:
Average Price Target: $210.62, implying a 23.66% upside from the current price.
High Price Target: $250.00, suggesting significant growth potential.
Consensus Rating: Moderate Buy based on evaluations from 43 analysts.
🔹 Regulatory Caution: DOJ lawsuits are a concern, but long-term AI & cloud growth remain strong.
📌 Key Levels to Watch:
Holding support at $165? This could trigger a major upside move.
Break above $190? Momentum could accelerate toward $207+
📢 Google is not just a search company—it’s an AI, cloud, and automation powerhouse. With strong support, favorable analyst forecasts, & major catalysts ahead, this could be a prime accumulation zone! 🚀

Search for GainsAlphabet Inc. has been exhibiting bullish momentum, with a notable gap forming around the $170 level, indicating renewed investor interest. This technical setup suggests the potential for a significant upward move, with the stock eyeing the $175 resistance level as a pivotal point. A successful breakout above this threshold could propel GOOGL toward the $191.79 resistance, offering an attractive risk-to-reward ratio for investors.
Why GOOGL Could Accelerate to $191.79:
Analyst Insights: Analysts have identified GOOGL as a potential rebound candidate for 2025, noting its inclusion among stocks that could recover after previous declines.
Technical Indicators: GOOGL's current price of $170.28 is approaching the 50-day moving average of $190.58, and a sustained move above this average could signal a bullish trend continuation.
tipranks.com
Financial Performance: In the third quarter of 2024, Alphabet reported revenues nearing $3.5 billion, with a net income of $238 million and an Adjusted EBITDA of $503 million, reflecting robust operational performance.
Strategic Initiatives: The company's recent pricing of $700 million in senior notes due 2030 indicates a strategic approach to strengthening its capital structure, potentially supporting future growth initiatives.
Key Levels to Monitor:
Support: $170 (gap level), $163.72 (stop-loss)
Breakout Trigger: $175 (weekly resistance)
Target: $191.79 (major resistance)
investopedia.com
If GOOGL maintains its bullish momentum and decisively breaks through the $175 resistance with substantial volume, it could be on track for a significant rally toward $191.79. However, investors should remain vigilant, as market conditions can change rapidly. Implementing a stop-loss at $163.72 is advisable to manage potential downside risks.
Disclaimer: This analysis is for informational purposes only and does not constitute financial advice. Investors should conduct their own research and consult with a financial advisor before making investment decisions.
NASDAQ:GOOGL

Google is going to its Google thing. Bullish 4hHistorical severely oversold area.
Welcome to the MAX PAIN (looking at the greed&Fear at 11 today)
At this max fear stage it’s hard for the herd to see wood for the trees and things also the perfect phase to pickup a contrarian play.
👇
🔹 **Trade Direction:** Long (Potential Reversal)
🔹 **Entry:** $170 - $173 (Current Zone)
🔹 **Stop Loss:** $165 (below recent support)
🔹 **Target 1:** $182 (key resistance level)
🔹 **Target 2:** $192.50 (prior swing high)
📊 **Probability & Justification:**
- **Momentum Shift:** Oversold conditions with multiple strong buy signals across timeframes.
- **Indicators:** Stochastic RSI deeply oversold, with RSI on daily at 27.16—historically near bounce zones.
- **Moving Averages:** Price trading below key moving averages but stabilizing.
- **Volume Profile:** Signs of potential accumulation; need confirmation.
⚠️ **Risk Considerations:**
- A breakdown below $165 invalidates the setup.
- Bearish sentiment still dominant; a confirmed higher low is needed.
- Strong resistance ahead at $182; partial profit-taking recommended.
📉 **Bias:** Cautiously bullish—confirmation required for trend shift.

Google - Buy Cycle Google
Buy cycle
Tp@206.75
% bubble
Price launched from the base at 206.75.
Potential Down Trend shown in the chart.
Treading plan:
We need to wait to see the price interaction with the trend line which will be a guide for deciding on the entries for the long position.
Spot orders:
Entry 1: 144
Entry 2: 124
Entry 3: 103
TP: 206

Bearish on short termI would consider the trend line a safe place to get in. Also the intersection with the strong support at 145 is a very bullish point, IF it gets there. Otherwise, just want for GOOG to reach the trend line.
Worst case scenario, if the bear market does take place, today's position will recover in about 1.5 years.


GOOGL - bears taking controlhi traders,
GOOGL ready for more downside.
The monthly time frame is pretty straightforward here.
Huge bearish engulfing is almost confirmed.
STOCH RSI with a bearish cross.
It's a time to retest the 50 simple moving average.
Bears will drag the price towards 135$ where we should see some bounce.
Lower prices are coming.
Check out our SPX analysis:


Google Likely On SupportGOOGL is likely finding support on $174. It's following the panic trend right now as almost everything Computer/Tech has been sold deep into support bids. GOOGL finding support here along with AMZN at $214 leads to my theory IXIC is ready to break resistance.
If it fails to hold $174, then the major support at $148 should lift it back up towards it's final target (or next major support) of $252.
Good luck!

Does the Corrective Bearish Rally Continue?GOOGL remains in a corrective downtrend, presenting potential opportunities for strategic entries. If the pullback deepens, we could capitalize on key support levels:
📉 Entry Points:
🔹 173
🔹 162
🔹 152
📈 Profit Targets:
🔹 181
🔹 189
🔹 206+
Will the price rebound from these levels, or will the downtrend extend further? Stay sharp and manage your risk accordingly.
Disclaimer: The information provided is for educational purposes only and does not constitute investment advice. Trading involves significant risks, and past performance is not indicative of future results. Always conduct your own analysis and consult a financial advisor before making any investment decisions.
