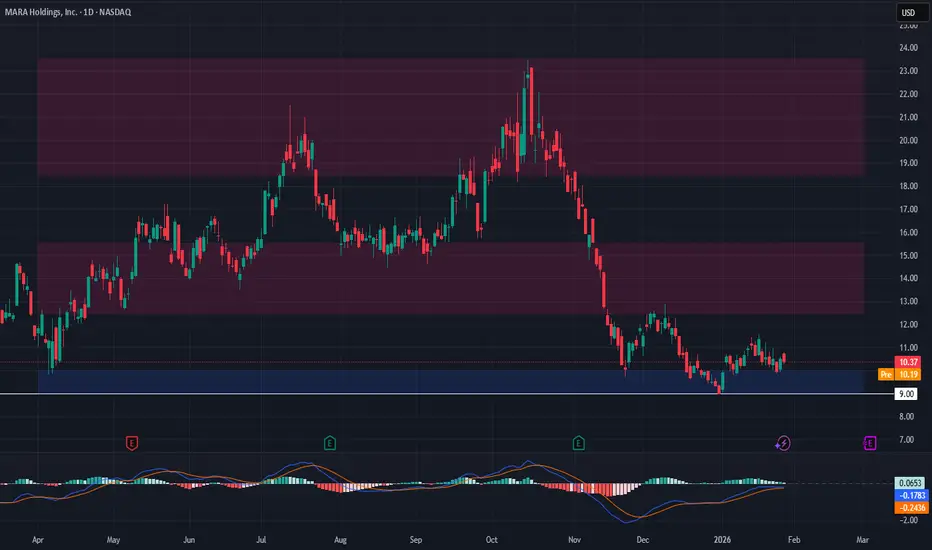
MARA: Is Set Up To MoveEyes on MARA ladies and gentlemen it has the pattern in place, once it bounces and if prints a higher low then that's the signal that tell us it will to test the $9 area and eventually higher.
Buckle up ladies and gentlemen and have those longs ready .
Play it right.......Play it safe......Play
Next report date
—
Report period
—
EPS estimate
—
Revenue estimate
—
2.43 USD
541.25 M USD
656.38 M USD
372.12 M
About MARA Holdings, Inc.
Sector
Industry
CEO
Frederick G. Thiel
Website
Headquarters
Hallandale Beach
Founded
2010
IPO date
Jul 28, 2014
Identifiers
3
ISIN US5657881067
MARA Holdings, Inc. is a digital asset technology company, which engages in mining cryptocurrencies with a focus on the Bitcoin ecosystem. It also deals with owning and operating bitcoin mining facilities or data centers, selling proprietary software or technology to third parties operating in the Bitcoin ecosystem, offering advisory and consulting services to support Bitcoin mining ventures in domestic and international jurisdictions, and generating electricity from renewable energy resources or methane gas capture to power Bitcoin mining projects. The company was founded on February 23, 2010 and is headquartered in Hallandale Beach, FL.
Related stocks

MARA Holdings Transfers $87 Million in BitcoinMARA Holdings Transfers $87 Million in Bitcoin Amid Broad Crypto Selloff and Miner Profitability Squeeze
MARA Holdings (NASDAQ: MARA), one of the largest publicly traded Bitcoin mining enterprises, has executed a substantial transfer of its digital asset holdings, moving approximately 1,317 BTC—valu

MARA double bottom!OptionsMastery:
🔉Sound on!🔉
📣Make sure to watch fullscreen!📣
Thank you as always for watching my videos. I hope that you learned something very educational! Please feel free to like, share, and comment on this post. Remember only risk what you are willing to lose. Trading is very risky but it can c

MARA, bottoming soon? Major support area...NASDAQ:MARA
🎯 Mara remains at the golden pocket support and channel lower boundary. It is below the weekly pivot and 200EMA, showing the bears are in control. Price appears to be in an Elliot wave 2, the lower trend line must hold here at the High Volume Node
📈 Weekly RSI is nearing oversold with

$MARA ThesisThe NASDAQ:MARA Thesis
The market price is a mood; the multiples are the reality.
NASDAQ:MARA is currently trading at $9.81, showing a 5.31% intraday gain. But look beneath the surface of the price action:
🔸️P/B Ratio: 0.77 — Trading significantly below its book value.
🔸️P/E Ratio: 4.09 — A

MARA – Support Retest Offering Swing OpportunityMarathon Digital Holdings NASDAQ:MARA has pulled back to retest the previous breakout level, which is now holding as support. This kind of price behavior often signals strength, especially when old resistance flips into support. We're seeing price action stabilize in the $9.00–$10.00 zone—an area
MARA Short-term analysis | Trading and expectationsNASDAQ:MARA
🎯 Previous downside target was hit, $8. Price dropped hard, changing the Elliott wave count completely, stopping at the golden pocket. Wave (Z) of B appears complete, but we need to see ahigher high to confirm
📈 Daily RSI went deep into oversold with bullish divergence and is now prin

Looking like its time to make a moveAs shown in the chart, the break out is similar to a few years ago. After which a long period of distribution and accumulation has followed. The pivot to data centers is real with first movers like iren, riot signing contracts. Mara is not stupid and will leverage their infrastructure as well.

MARA HoldingsNASDAQ:MARA
Perfect bounce off the 0.5 extension on the monthly timeframe.
The key question is when the 4-year range will finally break.
Next resistance is the Tenkan and 21 MA around $16.20.
Above that, the 0.618 level around $19.55 comes into play.

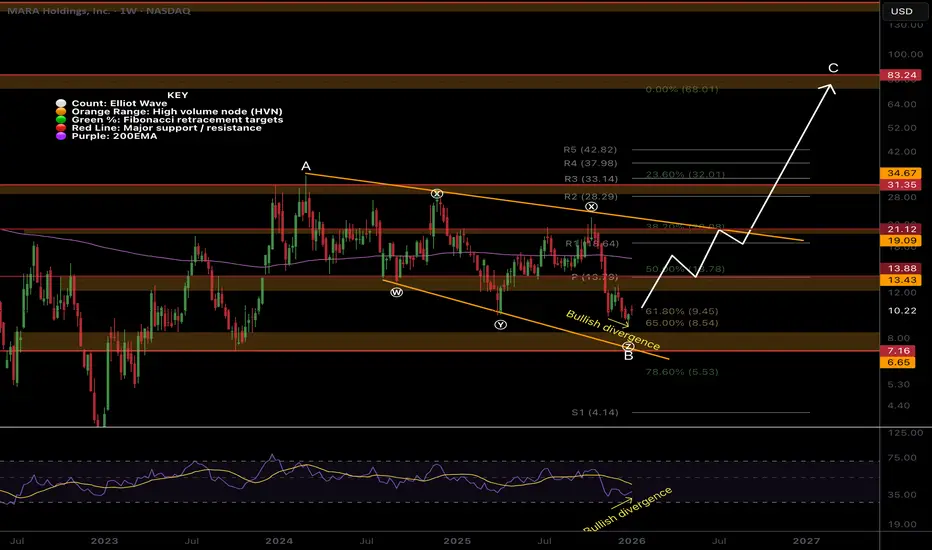
MARA Macro analysis | The bigger picture | Long-term holdersNASDAQ:MARA
🎯 Mara remains at the golden pocket support and channel lower boundary. It is below the daily pivot and 200EMA, showing the bears are in control. Price appears to be in an Elliot wave B, restricting upside targets to the 1:1 Fibonacci extensions at $106.
📈 Weekly RSI is nearing overso
See all ideas
Summarizing what the indicators are suggesting.
Neutral
SellBuy
Strong sellStrong buy
Strong sellSellNeutralBuyStrong buy
Neutral
SellBuy
Strong sellStrong buy
Strong sellSellNeutralBuyStrong buy
Neutral
SellBuy
Strong sellStrong buy
Strong sellSellNeutralBuyStrong buy
An aggregate view of professional's ratings.
Neutral
SellBuy
Strong sellStrong buy
Strong sellSellNeutralBuyStrong buy
Neutral
SellBuy
Strong sellStrong buy
Strong sellSellNeutralBuyStrong buy
Neutral
SellBuy
Strong sellStrong buy
Strong sellSellNeutralBuyStrong buy
Displays a symbol's price movements over previous years to identify recurring trends.
MARA6254515
MARA Holdings, Inc. 0.0% 01-JUN-2031Yield to maturity
—
Maturity date
Jun 1, 2031
MARA5513953
MARA Holdings, Inc. 1.0% 01-DEC-2026Yield to maturity
—
Maturity date
Dec 1, 2026
MARA6242435
MARA Holdings, Inc. 0.0% 01-MAR-2030Yield to maturity
—
Maturity date
Mar 1, 2030
MARA6153309
MARA Holdings, Inc. 2.125% 01-SEP-2031Yield to maturity
—
Maturity date
Sep 1, 2031
US565788AJ5
MARA Holdings, Inc. 0.0% 01-AUG-2032Yield to maturity
—
Maturity date
Aug 1, 2032
See all MARA bonds
Frequently Asked Questions
The current price of MARA is 7.92 USD — it has increased by 9.24% in the past 24 hours. Watch MARA Holdings, Inc. stock price performance more closely on the chart.
Depending on the exchange, the stock ticker may vary. For instance, on NASDAQ exchange MARA Holdings, Inc. stocks are traded under the ticker MARA.
MARA stock has risen by 9.54% compared to the previous week, the month change is a −29.16% fall, over the last year MARA Holdings, Inc. has showed a −51.02% decrease.
We've gathered analysts' opinions on MARA Holdings, Inc. future price: according to them, MARA price has a max estimate of 30.00 USD and a min estimate of 8.00 USD. Watch MARA chart and read a more detailed MARA Holdings, Inc. stock forecast: see what analysts think of MARA Holdings, Inc. and suggest that you do with its stocks.
MARA reached its all-time high on Mar 19, 2012 with the price of 234.00 USD, and its all-time low was 0.35 USD and was reached on Mar 16, 2020. View more price dynamics on MARA chart.
See other stocks reaching their highest and lowest prices.
See other stocks reaching their highest and lowest prices.
MARA stock is 11.35% volatile and has beta coefficient of 1.77. Track MARA Holdings, Inc. stock price on the chart and check out the list of the most volatile stocks — is MARA Holdings, Inc. there?
Today MARA Holdings, Inc. has the market capitalization of 3.00 B, it has decreased by −10.94% over the last week.
Yes, you can track MARA Holdings, Inc. financials in yearly and quarterly reports right on TradingView.
MARA Holdings, Inc. is going to release the next earnings report on Mar 4, 2026. Keep track of upcoming events with our Earnings Calendar.
MARA earnings for the last quarter are 0.27 USD per share, whereas the estimation was 0.02 USD resulting in a 992.04% surprise. The estimated earnings for the next quarter are −1.18 USD per share. See more details about MARA Holdings, Inc. earnings.
MARA Holdings, Inc. revenue for the last quarter amounts to 252.41 M USD, despite the estimated figure of 251.71 M USD. In the next quarter, revenue is expected to reach 251.64 M USD.
MARA net income for the last quarter is 123.13 M USD, while the quarter before that showed 808.24 M USD of net income which accounts for −84.77% change. Track more MARA Holdings, Inc. financial stats to get the full picture.
No, MARA doesn't pay any dividends to its shareholders. But don't worry, we've prepared a list of high-dividend stocks for you.
As of Feb 16, 2026, the company has 152 employees. See our rating of the largest employees — is MARA Holdings, Inc. on this list?
EBITDA measures a company's operating performance, its growth signifies an improvement in the efficiency of a company. MARA Holdings, Inc. EBITDA is 11.00 K USD, and current EBITDA margin is −6.24%. See more stats in MARA Holdings, Inc. financial statements.
Like other stocks, MARA shares are traded on stock exchanges, e.g. Nasdaq, Nyse, Euronext, and the easiest way to buy them is through an online stock broker. To do this, you need to open an account and follow a broker's procedures, then start trading. You can trade MARA Holdings, Inc. stock right from TradingView charts — choose your broker and connect to your account.
Investing in stocks requires a comprehensive research: you should carefully study all the available data, e.g. company's financials, related news, and its technical analysis. So MARA Holdings, Inc. technincal analysis shows the sell today, and its 1 week rating is strong sell. Since market conditions are prone to changes, it's worth looking a bit further into the future — according to the 1 month rating MARA Holdings, Inc. stock shows the sell signal. See more of MARA Holdings, Inc. technicals for a more comprehensive analysis.
If you're still not sure, try looking for inspiration in our curated watchlists.
If you're still not sure, try looking for inspiration in our curated watchlists.