NDAQ trade ideas


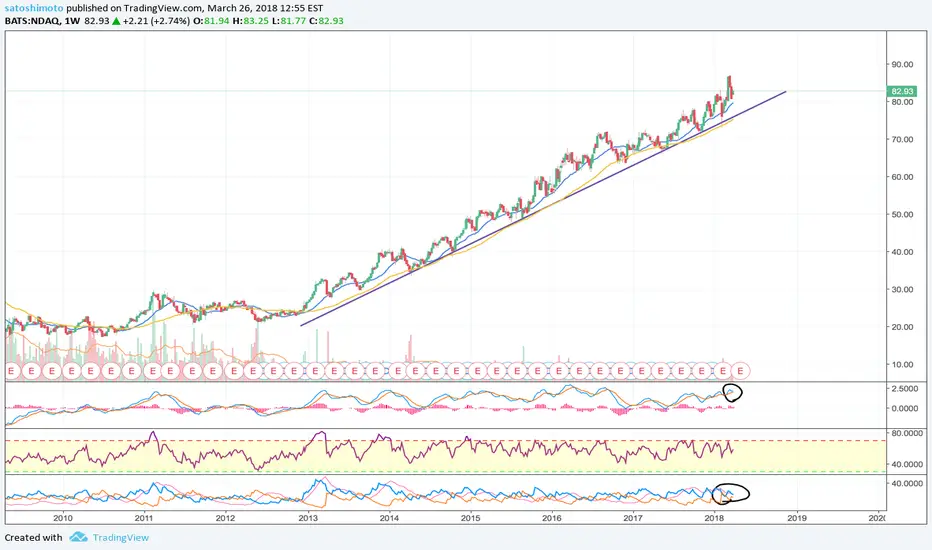
NASDAQ - "Save Me! Save Me!" *Not trading advice*I don't follow the stock markets too heavily. But a recent online post made me want to make a prediction by looking at the Nasdaq chart.
**Not trading advice, especially with a market i have not traded in extensively**
We should at the very least see a re-test of our 200 day MA in the mid-term. Looking at the fractal from 2005-2007, this looks sort of similar.
We could experience a 1-3 year recession, retrace to around the 50 fibo extension, and then continue back up on an even more moderate slope.
I've noticed with bitcoin that often each consecutive wave of price increase follows a trend that is more mild (slope decreases, less steep of a line, etc) than the previous rally. That is where my next projection comes from.
Wish I had more time to actually draw what i'm seeing on this chart. But alas, I have better setups to analyze (crypto!)
Good luck!


NDAQ - Expanding channel patternSymetrical Channel up broke up at june'12 and aug'15
this broke up trigger ascending channel pattern, as correction type pattern.
As we can see small ABCD fibonacci retracement pattern perform with target at 1.1618 around .382 major trend fibs.
this is a good level to enter long with target at B expanding pattern.
Disclaimer :
This analysis not include personal feeling/opinion, and pure base on technical analysis
Trading foreign currencies/stocks can be a challenging and potentially profitable opportunity for investors. However, before deciding to participate in the market, you should carefully consider your investment objectives, level of experience, and risk appetite. Most importantly, do not invest money you cannot afford to lose.


NDAQ - Bullish trend remainsAfter the sell-off on Monday 6/25, bullish price action appears over the moving average 50 days (blue line). Tomorrow is key to see if the price remains above this trend line, as it has been since March. Otherwise, the price will test the next support in the moving average 100 days (orange line).

NASDAQ longterm forecast.Hello Traders!
Tengri Traders vision concerning NASDAQ.
Subscribe to "Powerful Traders"!
Everyday, nine Tengri's traders, creates professional analysis, specializing on Elliotte wave theory, Technichal analysis,
Volume Spread analysis, Market Profile, Depth of Market, Order flow & Footprint.
We trade in all financial markets, there are no boundaries or limitations.
Join us!
«« «« «« «« «« Hold Like! »» »» »» »» »»
(If you have questions, comments, write, reply thoroughly!)
You're welcome!!!
Best regards, the team Traders "Powerful Traders".


NDAQ could be in troubleNDAQ has been on the same support line since November 2017! It seems to be working for now, but it has already tested $87 twice but was unsuccessful. When both this very strong resistance and this very strong support meet, it is possible to have a very large increase in price, or a large decrease in price to the past accepted support. We may see a drop up to 10%, or we may break out to see newer highs! until June 15 we will most likely continue in this trend we are currently in


NASDAQ is running out of timeJust like SPX and DJI, NDAQ is highly overbought. It is closely supported by MA 20 and MA 50. Funny enough, its long term support is pretty much the same as its MA 50.However, it it goes below the support levels it will tank like no other. You do not have to be a top trader or market analyst to see this. I do not know when the crash will take place but I am sure that we are getting close to it day by day.
This is not a trading advice and I am not responsible for any losses may occur from following the idea.


Can we time the NASDAQ?It would appear so. The NASDAQ has a clearly repeatable path that could be traded for profit. The graph shows the NASDAQ since 2014, with a trend channel plotted to show just how steady and contained the trend has been. The dotted line is halfway in the channel, and therefore represents the trend average.
Prices above this line have a greater chance of falling back to the average, and prices below it have a greater chance of rising above it. Ideally one would buy when the lower channel is crossed, and exit and when the upper channel is crossed. The blue price and time ranges show the price rally from middle to upper band. They also show the number of days to get there. So 7-10%, over 25 days (approximately) before the NASDAQ is overbought and poised to retreat.
Today we are 6% above the average, and 15 days in. Prices could rally another 2% over 10 days to complete the cycle, and cross the upper channel. When they fall it is -5% to the average, and -10% to the lower channel. The key is to not to perfectly market-time, but push the odds statistically in your favour. Therefore as a trader I would be selling out of my NASDAQ stocks, with buy limits at or below $78.


2018 - The Year of Financial BubblesCryptocurrencies have been a prominent theme around the world and have shown that our current paradigm of how we handle money and wealth can be challenged. Besides all the regulatory issues which only play at national level, blockchains have shown they will live further on their own without any authority being able to compromise them. Huge volatility is a result of this completely new territory, people see there is something different but cannot completely grasp it yet, often resulting in mania or a lot of anxiety. This emotional cycle is the way a market progresses and we can see the from micro to marco scale, time will eventually stabilize things before entering a new phase and repeating itself again.
The reason why I'm addressing cryptocurrencies (bitcoin/altcoins) is because they have had a lot of exposure and are being called bubbles. A bubble does not mean something does not have any value, this is a huge misconception and most people get scared in the media with a lot of fear when they see this word. A bubble is when reality and imagination are far apart, the expectations and the actual (current) practicability/productivity are then far out proportion because of misunderstanding or euphoria. Once the objectivity or data of what is plausible settles there is a huge pullback and this is when a "bubble" pops.
Now the media uses bubble repeatedly on bitcoin and cryptocurrencies but we are probably (intentionally) overlooking one of the largest bubbles currently playing, which is the "everything bubble".
Some examples are Wallstreet, NASDAQ, S&P 500 which represent way more money than cryptocurrencies even resemble. They have seen unprecedented growth and this is very likely coming to an end.
Technical analysis shows that we are at the verge of reversal, there could be some small growth short-term but long-term we are facing some major correction. Could the "bubble" media theme which addresses cryptocurrencies have finally popped the stock market bubble too? Making people realize that money can as easily be liquidated as it grows.
I don't have much pleasure calling the bubble of bubbles but it might soon become a reality. Once these larger corrections settle in people will slowly enter disbelieve and economies will start to shrink, more unemployment as a result. I think the tech bubble is also slowly starting to contract, personally I see people using less and less social media, both for privacy reasons and disinterest. Personal things tend to be shared in direct circles but commercial advertising is still growing on social platforms while many businesses compete online, sometimes pushing people away.
What areas do I expect to grow?
Since wealth will flow back to individuals, we could see more focus on the individual investments instead of corporate and stocks.
The priority of primary needs will play a increasing role, sustainable/independent living and having resources is important in an area of uncertainty and will always be something that enables us to fall back on something while our own economies are failing. A good example is Venezuela's hyperinflation, where the majority of families were not able to afford food anymore. Now this all sounds a bit extreme at first, we won't be at the brink of complete global collapse, but we should definitely realize there are these real-life scenario's playing. Only because they are far away doesn't mean they won't affect us.
2018 might be the year of larger sustainable adoption, solar for example, enabling independent generation of electricity could see a larger boom. If you understand that focusing on primary needs is important you see why.
Gold and silver, oil, food, could all see an increasing demand while people will have a greater demand for physical goods than virtual assets.
Good luck all, take care and don't forget to plan long-term too.
-TheTrex


NDAQ Operation LONG after the break out?Hello Traders,
This is my first idea published in english, sorry for the errors..:)
We are on NDAQ, weekly chart, the title has a powerful bullish rally, recently partially stopped.
On the daily chart we can see how the resistance that has formed the triple max on the weekly chart, has become an important support for the price.
In these days the price is moving laterally, in a small congestion with low volatility, (you can see the BB %B Indicator). We must wait a bullish break out, with an increment of volatilty for open a LONG position with a good risk/reward ratio.
