NFLX AnalysisPrice filled the fair value gap at 346.37 and did not respected the bullish OB at 375.87 according to my last analysis. However, if you've been following my analysis, you would have expected a bounce off the gap. Price is on a nice bullish momentum and has filled the fair value gap at 459.25 made in July. Right now, I'm expecting price to (1) make a bearish retracement, back into the bullish OB at 418.84, or (2) take out the highs at 485.00 and then follow the analysis in (1).
NFLX trade ideas

Netflix respect the pitchfork levels Hello everyone,
Since the beginning of November, I've taken a position on buying Netflix stock, and there are several reasons for that. First, there's the breakout of the bearish channel that persisted for weeks. Second, the volume indicates the momentum of buyers, potentially pushing the market to the red line of Pitchfork levels.
It's evident that these levels are respected by the market, so there's a high probability that it could continue rising until it reaches this red line (around $500) for long-term investment (a few weeks).
I hope you find my analysis beneficial, and don't forget to hit the like and follow buttons for more ideas.


NFLX ~ Snapshot TA (Daily / Nov 2023)NASDAQ:NFLX chart mapping/analysis.
Bullish recovery back into ascending parallel channel (green).
Bull target(s)
Breakout descending parallel channel (white) + descending trend-line confluence resistance
Overhead gap fills (~470 / ~506.93 / ~566.88)
Golden Pocket Fib + gap fill (~506.93) confluence resistance zone
Bear target(s)
Underlying gap fills (~412.52 / ~354.79 / ~341.38)
Ascending trend-line support (light blue dotted)
38.2% Fib
23.6% Fib

Netflix: Bearish Crab with Bearish ConfirmationNetflix recently traded just above the HOP level of a Bearish crab and has since gapped down below the 1.618 PCZ and given us a Bearish Divergence on all Oscillators as well as PPO Circle Confirmation. We could see Netflix begin a full retrace of the Harmonic range from here.

Is Netflix Stock A Buy After Third-Quarter ReportsInternet television network Netflix (NFLX) has a commanding lead in the streaming video market but its growth has slowed. NFLX stock cratered in 2022 after the company reported two straight quarters of subscriber declines. However, after a corporate course correction, some people might be wondering: Is Netflix stock a buy right now?
Subscriber Growth Drives Netflix Story
Netflix stock has benefited from the cord-cutting trend as people quit traditional pay-TV services.
Over the last several years, Netflix has been laser-focused on growing its global subscriber base. It wants to build a competitive moat with scale. It has been investing heavily in local-language original content production worldwide. Netflix stock performance is linked to its net subscriber additions.
But Netflix stock tumbled 51% in 2022 as subscriber growth stalled. Growth has rebounded in 2023 thanks to the addition of a lower-cost, advertising-supported service as well as a crackdown on unpaid account sharing.
In the third quarter, Netflix added 8.76 million subscribers worldwide, vs. forecasts for 6.06 million. It ended the third quarter with 247.15 million subscribers worldwide.
Netflix also announced price increases for its ad-free service plans in the U.S., U.K. and France.
Netflix stock soared 16.1% on the first trading day after it posted third-quarter results late Oct. 18.
Netflix Stock Fundamental Analysis
In the September quarter, Netflix earned $3.73 a share on sales of $8.54 billion. Analysts had called for earnings of $3.49 a share on sales of $8.54 billion. On a year-over-year basis, Netflix earnings rose 20% while sales climbed 8%.
However, Netflix's financial guidance for the fourth quarter was a tad below Wall Street's targets.
For the current quarter, Netflix predicted earnings of $2.15 a share on sales of $8.69 billion. Analysts had been looking for earnings of $2.17 a share on sales of $8.78 billion in the fourth quarter. In the year-earlier period, Netflix earned 12 cents a share on sales of $7.85 billion.
After a humbling performance in 2022, Netflix says it is focused on profitability. It also is targeting increased revenue with a lower-priced, advertising-supported service tier. Plus, it is looking to monetize rampant account sharing on the service and turn freeloaders into paying customers.
The next major catalyst for Netflix stock could be the company's fourth-quarter earnings report, due in late January.
Netflix Content Draws Subscribers
Since it started its original content push, Netflix has launched quite a few hit shows. They include "Stranger Things," "Squid Game," "Wednesday," "Ozark" and "Bridgerton."
It also has premiered popular original movies such as "Bird Box," "Extraction," "Murder Mystery," "The Old Guard" and "Red Notice."
Recent buzzworthy shows on Netflix include TV series "One Piece," "FUBAR" and "The Fall of the House of Usher." Popular new original movies include action films "The Mother" and "Extraction 2" and comedy "You People."
Meanwhile, Netflix is facing competition from traditional media companies. Max from Warner Bros. Discovery (WBD) launched in May 2023. Paramount Global (PARA) debuted Paramount+ in March 2021. Comcast (CMCSA)-owned NBCUniversal launched Peacock in July 2020.
Other services include Amazon (AMZN) Prime Video, Apple's (AAPL) Apple TV+, Walt Disney's (DIS) Disney+, Hulu and more.
Netflix Enters Video Game Market
To create a stickier service, Netflix added mobile video games as part of its subscription offering in November 2021. Subscribers can play the games on Android and Apple iOS smartphones and tablets.
Since September 2021, Netflix has purchased four game studios. It bought Night School Studio, Next Games, Boss Fight Entertainment and Spry Fox. It also has opened two new game studios.
Netflix currently offers about 80 games to subscribers. They include action, arcade, puzzle, racing, sports and casino games.
Netflix Stock Technical Analysis
On May 18, Netflix stock broke out of a cup-with-handle base at a buy point of 349.80. It climbed as high as 485 on July 19 before pulling back. Netflix hit its record high of 700.99 in November 2021.
Price Momentum
NFLX is trading near the top of its 52-week range and above its 200-day simple moving average.
What does this mean?
Investors have been pushing the share price higher, and the stock still appears to have upward momentum. This is a positive sign for the stock's future value.


Netflix Surges 28% Since Q3 EarningsNetflix's stock in 2021 has been a rollercoaster, starting with a strong 62% rise by July, nearing the $500 mark, before experiencing a sharp downturn. The stock fell below the crucial 200-day moving average to around $370, marking a significant 28% drop, but found some support at the weekly 50-day average near $350.
The Q3 earnings report was a turning point, with actual earnings of $3.73 surpassing the estimated $3.49. This led to a positive market reaction, with the stock opening 16% higher post-announcement and climbing 28% since then. The surge in earnings was primarily due to robust subscriber growth, a key indicator of the company's future financial health and stock potential.
Looking ahead, Netflix faces major resistance levels, first at the $500 psychological mark, and then at last year's high of $609. Overcoming these barriers could signal further bullish trends. As of November, the stock is showing strong performance with an 8% increase, adding to the positive outlook among investors.
If you enjoyed this post, make sure to like, and follow for more quality content!
If you have any questions or comments, comment below. We reply to every comment!
See below for more information on our trading techniques.
As always, keep it simple, keep it Sublime.


NETFLIX SHORT?NFLX short - take profit before earnings?
I shorted Netflix at $430. Up 20% on the position. Take profit before earnings tomorrow? What's your opinion on NFLX? Bear or bull? The mainstream media seems quite ambiguous ahead of earnings.
I took a lot of profit this year so I thought about sitting on it until next year. But I could also dump some of my NVDA short (325 avg) that I got over my head on.
this is not a financial advice.
Trade at your own risk.
follow for more.

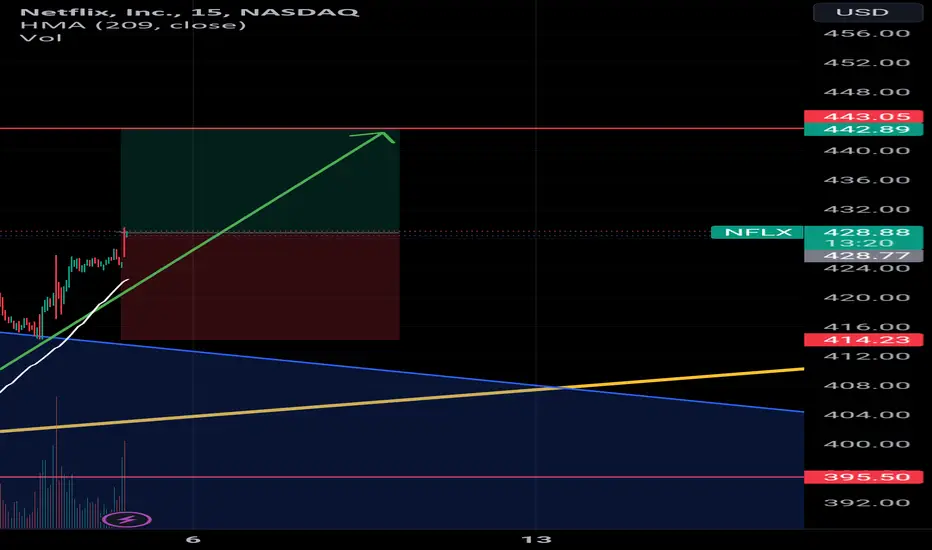
Long Signal on NITFLIX Hello enveryone,
We Have a fantastic long Signal on NITFLIX, with high probabilite and good Risk reward ration,
The target on this trader is going to be 450, with a stop loss of 439,
I Hope you find my Idea benifical, and make sure to hit the like and follow buttom for more ideas.

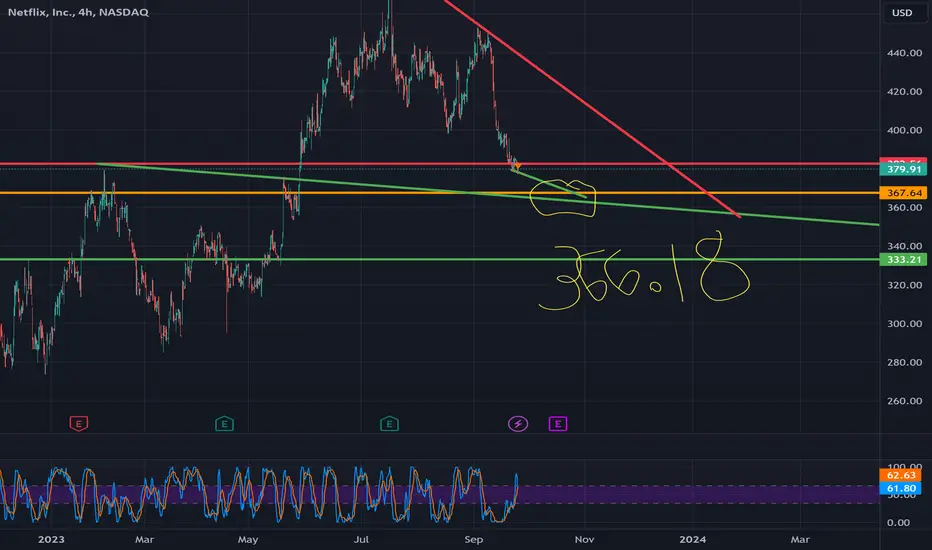
netflix approaching a big jumping pointHoly smokes, this is lining up for one huge final pump. If she holds 365, there is potential to rocket all the way up to 436. It won't be in 1 night, you'll have time to buy and sell, but it won't be a lot of time. You'll likely start seeing big AH movements, and a bunch of solid green days in a row as it climbs.
There is a chance it breaks down to 333, but again, there should be time to exit and reset your trade before it gets all the way down there. I would favor the upside pretty heavily on this trade, however, WAIT until it bounces off trend. If it hits the red trend, enter short on the rejection. If it climbs down and hits the green, go long on the support bounce.


The Netflix: Streaming The Stock's PotentialKEY POINTS
a. Netflix now has 15 million subscribers in its ad-supported tier.
b. The company is also rolling out new ad products.
c. The success of the new subscription tier is just one of the reasons the stock has surged this year.
The leading streamer just hit a key milestone with its ad business.
Netflix (NFLX 1.80%) was one of the best-performing stocks of the 2010s, but for much of the current decade, the once-meteoric growth stock has struggled to achieve liftoff.
The company got a temporary boost from the pandemic, only to give it all back and then some when the economy reopened in 2022, and it lost subscribers two quarters in a row. Since then, the streaming leader has regrouped, launching initiatives that some investors had long asked for, such as adding an ad-supported tier and cracking down on password sharing.
The results of those moves have been overwhelmingly successful with the stock up 47% year to date, even as many of its streaming peers like Disney and Warner Bros. Discovery are trading near 52-week lows.
With the help of paid sharing, Netflix has added nearly 15 million new subscribers over the last two quarters, beating its total additions from the previous five quarters. The stock jumped following the third-quarter earnings report in October on strong subscriber growth as well.
Building on this recent momentum, Netflix provided an update Wednesday that shows its new ad-based strategy is paying off.
A key milestone
It's been one year since the company launched its ad-supported tier in a handful of its biggest markets, and the company said the new service has now signed up 15 million subscribers, up from just 5 million in May. That news should not only tamp down concerns that growth from this tier has been weaker than expected but also show that the ad-supported option is clearly resonating with subscribers. Additionally, it's impressive to see those gains coming at a time when much of the digital advertising industry is struggling.
That figure represents more than half of net subscriber additions over the last year, though some of the ad-tier subscribers likely traded down from the more expensive ad-free tiers, especially after Netflix just raised prices on some of its plans in the U.S., U.K., and France.
Netflix has also refined its advertising product since launch and now offers five different ad lengths, ranging from 10 seconds to 60 seconds. It also offers targeting to mobile devices as well as options like more genres, time of day, and new audience demographics. Downloads are expected to be available by the end of the week, making Netflix the only ad-supported streamer to offer downloads.
The company has more new features planned for next year, including a binge-watching bonus that gives ad-tier subscribers an ad-free episode after they've watched three episodes in a row. It will also begin offering QR codes in ads and is expanding its partnerships program globally, allowing advertisers to sponsor certain shows.
Netflix's ad-supported tier may cannibalize some ad-free subscribers, but that's part of the company's strategy. Offering ads gives it cover to raise prices on ad-free tiers, as it just did, allowing the company to make more money from the ad-free side of the business (with the idea that the ad-supported tier should be revenue-neutral compared to the ad-free subscription, as it has been for Hulu).
The ad-tier option also capitalizes on massive existing demand from advertisers. As former CEO Reed Hastings noted in an Oct. 2022 earnings call, advertisers have been left behind by the transition to streaming and are anxious to follow the eyeballs that have already gravitated over to streaming services.
With more than 200 million subscribers globally, intimate knowledge of their viewing habits, and the ability to perform precise targeting, Netflix can offer advertisers much more than a traditional linear TV platform.
Why it's a buy
A little more than a year ago, investors seemed to think the growth story at Netflix was over. However, the recent rebound and strength from paid sharing and advertising shows the streamer's second act is well underway.
The company forecast subscriber additions of around 9 million in the current quarter, showing the recent momentum should continue, and its subscription business model means that incremental revenue flows through to the bottom line. Indeed, management sees operating margin improving from 20% this year to 22% to 23% in 2024.
If Netflix can continue to deliver subscriber growth, there's room for profits to go significantly higher. The success of the ad-supported tier will only make that easier.

[EN] Netflix at all-time highs // GaliortiTrading NASDAQ:NFLX in late July attacked the 61.8% Fibonacci of the entire previous decline since November 2021 . It pulled back to its liquidity zone between $370-385 from which it has made a new impulse. Final target: new all-time highs .
1 M
On a long term chart we note that NASDAQ:NFLX in July 2022 rested on its bullish trendline to develop a new bullish leg . Its final target for the next few years would be around $2,000.
1 W
In the shorter term on a weekly chart we observe that NASDAQ:NFLX is developing a symmetrical triangle that is highly likely to break to the upside . The minimum target for such a breakout would take it to around $580 . It should be remembered that the first obstacle after that breakout will be the 61.8% Fibonacci ($492) so it is likely to make a pull-back to the breakout line. In addition, the bearish gap from the end of July will be a resistance to be taken into account.
The 470-495$ is a great liquidity zone that will allow it to perform a new bullish wave with a first target at 580$ (target of the broken triangle) and a second target at new all-time highs.
1 D
The company's third quarter results have led to a large bullish gap with a large volume (the second largest of the year), this translates a great strength as demonstrated by the verticality of the rise. It is logical that in the coming days there could be a correction as prices hit the medium-term downtrend line . It will be a healthy and necessary correction to develop a new momentum that will allow it to definitively leave the 61.8% Fibonacci level .
Pablo G.

Flix... NetflixPrice is consolidating in a narrow range and forming a wedge pattern.
Trend deciding zone is 418 - 422. Above this zone price can gain momentum.
Where to buy?
Buy above 414 with the stop loss of 410 for the targets 418, 422, 426 and 430.
Where to sell?
If price did not gain bullish strength, sell below 406 with the stop loss of 410 for the targets 402, 398, 394 and 390.
As of now price is in neutral zone. Do your own research before taking any position.


Netflix in a fall, unless it breaks the channelAn unlikely winner in the current recession, Netflix could continue a trend down unless it breaks out the trend channel within the remainder of October. Despite promising results earlier this week, Netflix bounced on the channel's upper edge. Now this could be only a resolution of a few targetted positions by a few traders aware of the channel, but if the trend isn't broken within the next five days, or the price comes back to the PEG ground, the downtrend of Netflix will continue.

Netflix Consolidates After Earnings Surge Netflix jumped earlier this month after announcing results. It’s now consolidating, and some traders may see potential for more upside.
The first pattern on today’s chart is the bullish gap on October 19 following the quarterly report. Prices cleared a peak of $394.90 from two weeks prior and have remained there since. Has old resistance become new support?
Second, that level is near the 50-day simple moving average (SMA).
Third, NFLX is now trying to form a bullish inside week. That could indicate the stock is digesting its gains and consolidating.
Next you have the falling trendlines along the peaks of July and September. Traders could be watching for a breakout through this resistance.
Short-term indicators may also have gotten more bullish: The 8-day exponential moving average (EMA) is above the 21-day EMA, and MACD is rising.
Last, the fundamental case may have improved because NFLX entered earnings season under a cloud of negativity. It then shocked the bears with strong subscriber growth, making it a potential turnaround story.
TradeStation has, for decades, advanced the trading industry, providing access to stocks, options, futures and cryptocurrencies. See our Overview for more.
Important Information
TradeStation Securities, Inc., TradeStation Crypto, Inc., and TradeStation Technologies, Inc. are each wholly owned subsidiaries of TradeStation Group, Inc., all operating, and providing products and services, under the TradeStation brand and trademark. TradeStation Crypto, Inc. offers to self-directed investors and traders cryptocurrency brokerage services. It is neither licensed with the SEC or the CFTC nor is it a Member of NFA. When applying for, or purchasing, accounts, subscriptions, products, and services, it is important that you know which company you will be dealing with. Please click here for further important information explaining what this means.
This content is for informational and educational purposes only. This is not a recommendation regarding any investment or investment strategy. Any opinions expressed herein are those of the author and do not represent the views or opinions of TradeStation or any of its affiliates.
Investing involves risks. Past performance, whether actual or indicated by historical tests of strategies, is no guarantee of future performance or success. There is a possibility that you may sustain a loss equal to or greater than your entire investment regardless of which asset class you trade (equities, options, futures, or digital assets); therefore, you should not invest or risk money that you cannot afford to lose. Before trading any asset class, first read the relevant risk disclosure statements on the Important Documents page, found here: www.tradestation.com .

NETFLIX Can it realistically reach $600 in this environment?Netflix (NFLX) has established itself above the 1D MA50 (blue trend-line) since the aggressive price jump of October 19 on its bullish earnings. Still, the price is failing to break above the top (Lower Highs trend-line) of the blue Channel Down and technically the longer it fails to do so, the higher the chances become of a rejection. Until that happens, we can see that during similar 1D MA50 consolidations after price jumps in the recent past, Netflix rallied more. Now it has the 1W MA100 (red trend-line) as its long-term Support, hence a potential new rally can be even stronger.
The previous 3 medium-term rallies have hit (or marginally missed) the 2.0 Fibonacci extension, so that is our target in case the price breaks above the top of the Channel Down. $600 is technically fair as it is on the Higher Highs trend-line of the Bullish Megaphone. Time-wise, this target is achievable by January 2024 as this is what the Sine Waves suggest. As you can see all 3 previous Higher Highs have been within the peak spectrum of the Sine Wave.
-------------------------------------------------------------------------------
** Please LIKE 👍, FOLLOW ✅, SHARE 🙌 and COMMENT ✍ if you enjoy this idea! Also share your ideas and charts in the comments section below! This is best way to keep it relevant, support us, keep the content here free and allow the idea to reach as many people as possible. **
-------------------------------------------------------------------------------
💸💸💸💸💸💸
👇 👇 👇 👇 👇 👇

Netflix Q3 EarningsNFLX Q3 September 2023 earnings are on Wednesday 10/18/23 at 4pm. Netflix (NFLX) reported earnings of 3.29 per share on revenue of 8.19 billion for the second quarter ended June 2023. The consensus earnings estimate was 2.83 per share on revenue of 8.27 billion. The company beat expectations by 13.84% while revenue grew 2.72% on a year-over-year basis. The company said it expects third quarter earnings of approximately 3.52 per share on revenue of approximately 8.52 billion. I'm posting this as a long because of the setup with NFLX price at its VWMA200 level.
Q3 September 2023 Consensus:
EPS = 3.47
Revenue: 8.43B
VWMA 50 = 409.41
VWMA100 = 417.44
VWMA200 = 369.33
YTD anchored VWAP = 374.60
TTCATR20:
R3 = 424.27
VWMA20 = 385.69
S3 = 347.10
Options data:
10/20 expiry
Put Volume Total 14,812
Call Volume Total 15,144
Put/Call Volume Ratio 0.98
Put Open Interest Total 82,510
Call Open Interest Total 67,499
Put/Call Open Interest Ratio 1.22
highest open interest call strike = 390
highest volume call strike = 370
highest open interest put strike = 350
highest volume put strike = 365
