TLT: Buy ideaA high probability of an upward trend on TLT in the event of a strong break of the resistance line as well as the vwap.
TLT trade ideas

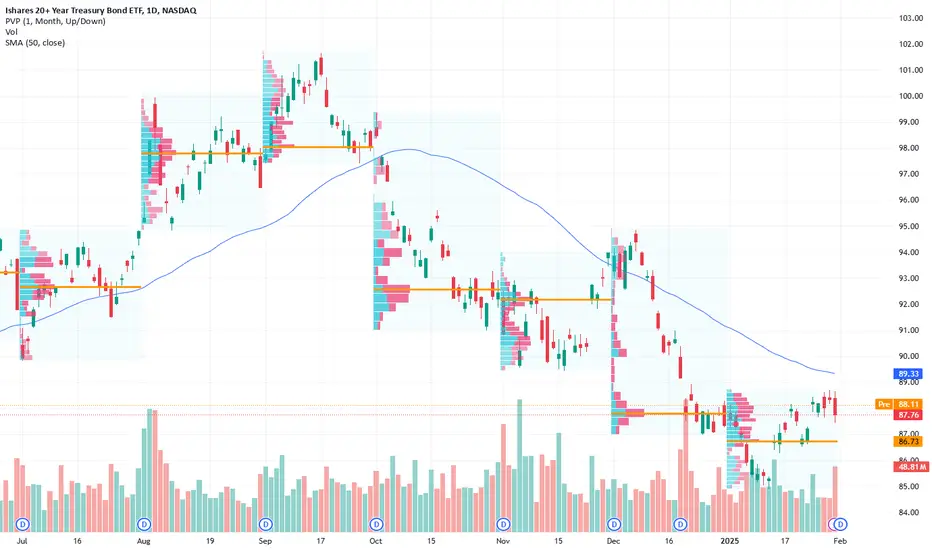
Dip Buying Opportunity In TreasuriesHot CPI providing a good dip in Treasuries which could recover quickly like a similar dip in late May 2024. We are in a buy support zone given the last year or so of trading range.

Invest in TLT for Stability Amid Market Volatility
- Key Insights: TLT has shown resilience by maintaining its position above the
50-day moving average, highlighting its appeal as a safe-haven asset amid
stock market volatility. The ongoing demand suggests that investors are
looking for protective measures against macroeconomic challenges. A
supportive environment could see TLT potentially rallying higher, making it
an attractive opportunity for those seeking stability in uncertain times.
- Price Targets: Next week targets are as follows: T1 is set at 91.50, T2 at
94.00. For stop levels, S1 is at 87.00 and S2 at 85.50. This framework
offers a clear strategy for both entry and risk management, reflecting
current technical support and resistance dynamics.
- Recent Performance: TLT has experienced mixed performance amid fluctuating
bond market conditions. While the broader market has seen sell-offs, TLT's
ability to hold above important technical levels reflects its appeal to
risk-averse investors. The overall sentiment indicates that many are
favoring bonds over equities as they navigate uncertain economic conditions.
- Expert Analysis: Experts point to TLT's attraction as a hedge against equity
market instability. The prevailing risk-off sentiment has boosted demand for
long-duration bonds, with analysts suggesting that buying pressure may
propel prices higher if macroeconomic fears persist. This reflects a
fundamental shift in investor behavior, emphasizing the need for security
amid existing volatility.
- News Impact: There haven't been significant news events directly tied to TLT
recently, but the prevailing environment of stock market turbulence has
prompted many to flock to bonds as a safer investment alternative. The
ongoing dialogue around Federal Reserve monetary policy and its impact on
yields is also influencing market dynamics, shaping a complex narrative that
underscores the significance of TLT in the current financial landscape.

$TLT yieaahhhliking NASDAQ:TLT here.
This is a monthly chart fyi
1. Forming nice head and shoulders knees and toes
2. RSI and price divergence since 2023
3. just bounce of a strong line of support last 2 months
My gut says if we break the resistance at current price, we can go quickly to $94.
Medium term, $120 will act as a magnet with the lack of volume between current price and that area.
Long term aiming for the green dotted line for the middle of the channel, but hey I ain't got no patience.
Playing for the $94 and then hopefully $120 comes fast.
This asset tends to do good when there is market turmoil, at least it has done it in 08, and covid. Just putting this out there while wearing my tin foil hat of cheap aluminum.
yieaahhh

TLT BONDS ELLIOTT WAVE ANALYSIS - MOVE FORWARD©Master of Elliott Wave: Hua (Shane) Cuong, CEWA-M (Master Designation).
Conclusion: TLT BONDS continues to move higher, expected at 90.92 - 92.63.
Wave 1-grey may have just ended, and wave 2-grey is starting to move higher as ((a))((b))((c))-navy, expected to target around 90.92 - 92.63.
While price must remain below 94.85 to maintain this Bearish view.
On the other hand, the ALT scenario shows no further push lower, instead, wave (B)-orange has just ended, and wave (C)-orange is moving much higher, expected to reach 101.64. The key to triggering the ALT is a break above the 92.63 level.

TLT entry point at 89, take profit at 110, good luck guys!As we predicted in previous analyses, Trump's populism knows no bounds, which is why over the next four years we will continue to witness numerous statements, threats, promises, and their softening when it comes to implementation.
This was Trump 1.0, and this is what Trump 2.0 will be like over the next four years. He is afraid of a stock market crash, he fears the numbers, he fears inflation, and he fears high interest rates.
A new attractive entry point for TLT could be 89. And over the next 1-2 years, expect it to reach 110+.
10y market promises ~3.5% yield.

Update: TLT March 21st 95 Covered CallsA "refresh" of a fairly long-running cash flow setup, with the cash flow emanating from (a) short call premium and (b) dividends.
As of the 12/18/24 dividend, my break even is at 85.81 (including dividends). (See Post Below).
One of my New Year's resolutions is to be a little more patient and roll out the short call on approaching worthless, targeting the short call strike paying around 1% of the strike price in credit, but my mouse hand occasionally seems to have a mind of its own ... .

Long TLT Next Week: Watch for Key Levels and Volatility
- Key Insights: Investors should consider TLT as a hedge against volatility,
particularly in the tech sector. The ETF's role as a stabilizer in uncertain
markets aligns well with current sentiment, making it a tactical choice for
diversifying portfolio risk.
- Price Targets:
- Next week targets: T1 = 89.00, T2 = 90.00
- Stop levels: S1 = 87.00, S2 = 86.50
- Recent Performance: TLT has shown increased interest from investors seeking
safe-haven assets, reflecting a growing demand for long-term treasury bonds
amid macroeconomic uncertainties. The ETF is currently trading near its
critical support level, demonstrating resilience against fluctuations in
stock prices.
- Expert Analysis: Financial experts advocate for incorporating TLT into hedging
strategies, emphasizing its correlation with bond yields and economic
indicators. Understanding interest rate movements and inflation expectations
will be crucial for navigating the current investment landscape,
particularly with the ongoing volatility in the equity markets.
- News Impact: Recent developments regarding interest rates and inflation
concerns are placing upward pressure on bond yields, impacting TLT's
performance. As major indices inch closer to record highs amidst market
turbulence, TLT's position as a risk-averse asset is gaining prominence and
will be influenced by broader economic policies and market sentiment.
Market Update - 2/9/2025Caught the EP nicely on NASDAQ:AFRM , and the breakout on NASDAQ:MGNI , but other than that we're still in a bad environment, the distribution days and declining breadth are not good signs. Will remain cautious.

Opening (IRA): TLT April 17th 82 Covered Call... for an 80.60 debit.
Comments: Laddering out at strikes better than what I currently have on (Feb 87's, March 84's). Selling the -75 delta call against shares to emulate the delta metrics of a 25 delta short put, but with the built-in defense of the short calls. Plus, gotta be in shares to grab that divvy.
Metrics:
Break Even/Buying Power Effect: 80.60/shares
Max Profit: 1.40
ROC at Max: 1.74% (excluding dividends)
Ordinarily, I take profit at 50% max, but will wait until the dividend immediately preceding the monthly expiry drops before considering taking profit.

Opening (IRA): TLT February 21st 87 Covered Call... for a 85.97 debit.
Comments: Going long at or near November lows, selling the -75 call against shares to emulate the delta metrics of a 25 delta short put, with the built-in defense of the short call. I'm also looking to snag the January and potentially the February dividends here. This is a bit longer-dated than I ordinarily like to go, but I'm not doing a ton here besides waiting for January setups to come in/be managed.
The obvious variant is to sell the standard -30 delta against: TLT Feb 21st 94 covered call, 89.72 debit, 4.28 max. 4.77% ROC at max where the short call is paying >1% of the strike price in credit.
Metrics:
Buying Power Effect/Break Even: 85.97/share
Max Profit (ex. dividends): 1.03
ROC at Max: 1.20%
50% Max: .52
ROC at 50% Max: .60%
Will generally look to take profit at 50% max after at least the January dividend drops.

Opening (IRA): TLT March 21st 84 Covered Call... for an 82.72 debit.
Comments: Laddering out into 2025 at strikes/break evens better than what I currently have on, looking to snag January, February and potentially March dividends ... .
Metrics:
Buying Power Effect/Break Even: 82.72/share
Max Profit: 1.28
ROC at Max: 1.55%
50% Max: .64
ROC at 50% Max: .77%

HIGH chance of a bottom in BONDS great time to enter bonds, as TLT is signaling a bottoming formation and yields most likely have topped

Opening (IRA): TLT March 21st 81 Covered Call... for a 79.98 debit.
Comments: Adding a "rung" in March at a break even better than what I currently have on, selling the -75 delta call against shares to emulate the delta metrics of a 25 delta short put, but with the built-in defense of the short call.
Metrics:
Buying Power Effect/Break Even: 79.98/share
Max Profit (Excluding Dividends): 1.02
ROC at Max (Excluding Dividends): 1.28%
Generally looking to roll out-of-the-money short call down and out for a credit that is greater than the amount of strike destruction at expiry to generate a quasi-free cash flow setup consisting of (a) short call premium; and (b) dividends. This differs somewhat than what I would ordinarily do, which is generally money/take/run at 50% max.

$TLT Bullish CypherReal nice look here on TLT for a wave 1 and 2, forming the bullish cypher at the lows.
This is an update to our trade from Oct 23 and a secondary entry here on the 3day, with triple bullish divergence on the weekly.
Macro momentum hasnt turned up quite yet, but obviously on the higher time frames thats going to be lagged pretty good. The daily however is just now beginning to cross up, and will continue rising above 85, with an expectation of exhaustion as high as 130.
The daily ADX is also rolling over and signaling the end of the bearish trend. Volatility is still contracting on the daily, so it could take a little time to get an expanding environment of the lows, which would be inline with a type 2 reaction / db locally here at the 886.
Theres always a chance youll get a sweep of the lows for a spring event, but that isnt being suggested here. If this happens i would consider it an opportunity for options, if the break lower is rejected and the range is reclaimed as support.
A lot of implications here if we see this play out.

TLT long, long and only long, don't give up and keep it with youAgain me and again my TLT)))
First of all we should keep safety and creditworthiness U.S. Treasuries are backed by the U.S. government, making them one of the safest investments globally. They are considered risk-free in terms of credit risk, as the U.S. government has never defaulted on its debt.
The second one and the most important point - we have ATTRACTIVE Yield Opportunities
10y 4.77%
20y 5.041%
30y 4.959%
Starting from the 1980s, this is the second time the Fed is cutting interest rates while yields are rising. Of course, this carries certain risks, and experienced investors know that the 1980s were not the best times for reliable investments.
The market is anticipating a new wave of inflation, and professional participants do not agree with the Fed's 1% cut. Especially with the 50-basis-point decision in September. Up to this point, many believe that the fight against inflation has failed, and some banks even fear that not only will the rates remain unchanged, but further hikes are possible.
No, no, and once again, no.
With inflation at 3% or a bit higher, rates of 4.5% cannot logically rise further. They might remain unchanged for an extended period or be reduced slightly, taking macroeconomic indicators into account.
Currently, the market is not moving out of fear of a strong labor market or high inflation but exclusively out of fears related to the Trump administration. These include promises of new sanctions, tough measures against migration, and tax relief. I honestly believe that of the aforementioned, only the tax relief will be fully implemented. There will be a few formal sanctions, primarily targeting China, while migration policies will remain election promises and not actionable programs.
In the face of all this, we have very low TLT and very high yields for 20+ or even 10y, which are truly worth our bid.

US Stocks - The Situation Is CriticalFollowing the strong US economic data, the markets are in panic mode: Hopes of further interest rate cuts are fading like ice cream in the summer sun. A look at the TLT chart does not bode well. The monthly chart shows extremely strong hidden bearish divergences in the OBV. I have written an indicator for private use that draws these divergences clearly visible on the chart (blue line: price; green line: OBV).
Let's not kid ourselves: The situation for the US markets is currently quite grim from both a technical and fundamental perspective.

TLT 2024 - DRV Monthly Seasonality StatsThe TLT (iShares 20+ Year Treasury Bond ETF) has exhibited notable volatility and seasonal trends from 2015 to 2024. Historically, TLT shows consistent positive returns in January, with significant gains in 2015 and 2023, but negative returns in 2022. February often sees mixed results, with TLT showing both positive and negative returns across the years, notably performing well in 2020 and 2023. March and April typically show more stable returns, with occasional dips in April, particularly in 2018 and 2021. May and June are generally weaker months for TLT, with losses in several years, notably in 2018 and 2022, though 2020 and 2023 displayed some positive movement. July tends to see moderate gains in most years, with especially strong returns in 2019 and 2021. August has a mix of gains and losses, with TLT showing a sharp decline in 2019 and 2022, but improving slightly in other years. September and October show consistent weakness, with TLT typically underperforming in these months. November and December offer some positive results, with strong performances in 2020, 2021, and 2022, which may reflect seasonal market trends or investor rotation into bonds as a safe haven toward the end of the year.
In the recent Federal Reserve meeting, Chair Jerome Powell emphasized the central bank's commitment to its dual mandate of fostering maximum employment and maintaining price stability. He noted that the Fed's decisions are data-driven and not influenced by political considerations. However, with the incoming administration expressing concerns over high interest rates, there is potential for tension between the Fed's independent monetary policy and the administration's fiscal objectives. The administration has indicated a preference for lower interest rates to stimulate economic growth, which could lead to pressure on the Fed to adopt a more accommodative stance. Such political dynamics could influence the Fed's policy decisions, potentially leading to more aggressive rate cuts or even discussions around negative interest rates. If the Fed were to lower rates significantly or implement negative rates, it could have profound effects on the economy, including encouraging borrowing and spending, potentially leading to higher inflation and impacting the value of the U.S. dollar. For investors in TLT, such policy shifts could affect bond yields and prices, as lower interest rates typically result in higher bond prices. Therefore, monitoring the interplay between the Fed's monetary policy and the administration's fiscal stance will be crucial for understanding future movements in the bond market.

TLT or TMF?Are we heading to a flight to safety while the nation stabilizes under the new administration, all time highs on low breadth, AI fueling junk markets. A DASH to TRASH, often rings the bell for a serious correction, as we have been trained to buy the dip, we may be in a Bull Trap.
Either way, I will have this play on deck.
Share your thoughts on my thoughts... NASDAQ:TLT AMEX:TMF

$TLT long to 110 on February 20, 2025Everything is on the chart.
I am calling for TLT to rally from today's closing price of $86 to $110 by Thursday, February 20, 2025.
The Javier Milei Argentina experiment has been a huge success for Argentina, who is buddy buddy with the J's and Elon Musk, both of whom are buddy buddy with Trump.
At the time of this writing, $105 calls for 2/21/2025 are .05 each. If the target hits, they will be worth $5.0, for a total return of 10,000% (10X).
On the weekly chart, you can see the 200 week SMA coincides with my level on that date as well.
Feel free to share.

TLT HAS BOTTOMED TODAY at 85.34 a perfect .786 of wave A downThe chart posted is the TLT we have now reached a fib relationship at today low of .786 of wave or wave 1 both counts calls for a sharp rally back above 90 plus or mins 1 I have now moved to a 40 % net long in the money calls best of trades wavetimer

TLT BOND ELLIOTT WAVE ANALYSIS: 7 JAN, 2024©Master of Elliott Wave: Hua (Shane) Cuong, CEWA-Master.
The entire ((4))-navy wave most recently finished as an (A)(B)(C)-orange Zigzag, and the ((5))-navy wave is turning back to push lower. It is subdividing into waves 1,2-grey, and they are complete, since the high of 94.85 the 3-grey wave is unfolding to push lower, targeting the low of 83.58.

$TLTa good hedge yieahh
volume gap till $117 area
higher lows seem to be forming
If I was conservative I would wait to break previous high and test that new support, but you know me I am already in for long term.
RSI and MACD going up
