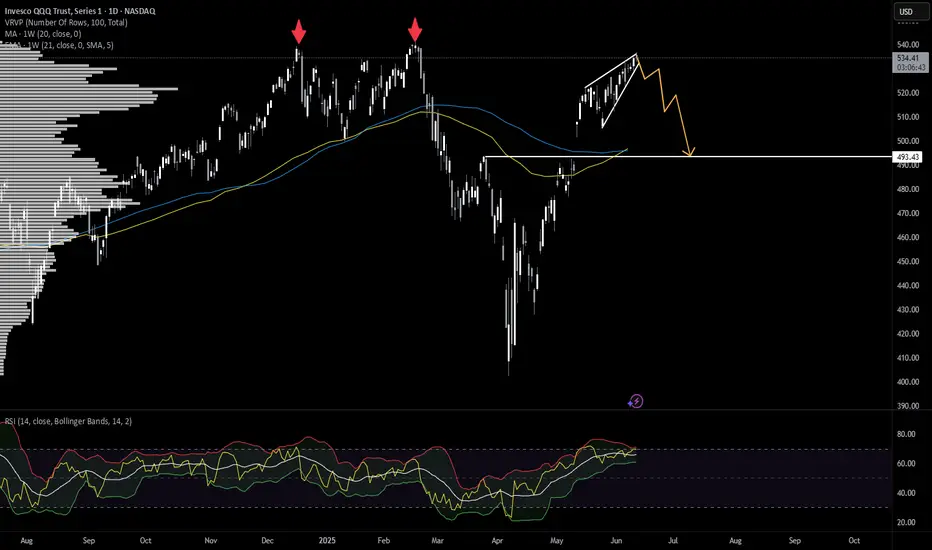
$QQQ — Bearish Setup Forming Near Highs📉 NASDAQ:QQQ — Bearish Setup Forming Near Highs
Technical Confluence:
Rising wedge structure into prior highs
RSI bearish divergence (momentum fading)
Volume steadily drying up on this recent move
Price stalling under key resistance zone (Feb–April supply)
Execution Plan:
I’ve ti
Invesco QQQ Trust, Series 1
529.08USDR
−5.21−0.98%
Last update at Jun 17, 23:59 GMT
530.50USD
+1.42+0.27%
No tradesPre-marketLast update at 13:21 GMT
Key stats
About Invesco QQQ Trust, Series 1
Home page
Inception date
Mar 10, 1999
Structure
Unit Investment Trust
Replication method
Physical
Dividend treatment
Distributes
Distribution tax treatment
Qualified dividends
Income tax type
Capital Gains
Max ST capital gains rate
39.60%
Max LT capital gains rate
20.00%
Primary advisor
Invesco Capital Management LLC
Distributor
Invesco Distributors, Inc.
QQQ is one of the most established and actively traded ETFs in the world, albeit one of the most unusual. The product is one of a few ETFs structured as a unit investment trust. Per the rules of its index, the fund only invests in nonfinancial stocks listed on NASDAQ, and effectively ignores other sectors too, causing it to skew massively away from a broad-based large-cap portfolio. QQQ has huge tech exposure, but it is not a 'tech fund' in the pure sense either. The fund's arcane weighting rules further distance it from anything close to plain vanilla large-cap or pure-play tech coverage. The ETF is much more concentrated in its top holdings and is more volatile than our vanilla large-cap benchmark. Still, the fund has huge name recognition for the underlying index, the NASDAQ-100. In all, QQQ delivers a quirky but wildly popular mash-up of tech, growth, and large-cap exposure. The fund and index are rebalanced quarterly and reconstituted annually.
Classification
What's in the fund
Exposure type
Technology Services
Electronic Technology
Retail Trade
Stock breakdown by region
Top 10 holdings
Symbol
Assets
Symbol
Assets
M
Microsoft CorporationMSFT
8.74%
N
NVIDIA CorporationNVDA
8.66%
A
Apple Inc.AAPL
7.31%
A
Amazon.com, Inc.AMZN
5.62%
A
Broadcom Inc.AVGO
4.80%
M
Meta Platforms Inc Class AMETA
3.77%
N
Netflix, Inc.NFLX
3.16%
T
Tesla, Inc.TSLA
2.94%
C
Costco Wholesale CorporationCOST
2.64%
G
Alphabet Inc. Class AGOOG
2.53%
Top 10 weight50.17%
102 total holdings
No news here
Looks like there's nothing to report right now

QQQ - Weekly Volatility PotentialGood Morning --
Last week we reviewed the potential of the S&P 500, this week let us take a look at the potential perspective of NASDAQ:QQQ .
IV (17.97%) entering the week is trending 31% IVp on the year and has been gradually lowering as price action grinds higher and out of corrective territo

QQQ On The Rise! BUY!
My dear friends,
My technical analysis for QQQ is below:
The market is trading on 526.92 pivot level.
Bias - Bullish
Technical Indicators: Both Super Trend & Pivot HL indicate a highly probable Bullish continuation.
Target - 530.98
About Used Indicators:
A pivot point is a technical analysis


QQQ new lows incoming?QQQ has been consolidating in a massive rising wedge and looks set to break down from it.
Unless price can get back above previous highs, then new lows is the most likely outcome here.
I've marked off support levels on the downside that might be good opportunities to scale in on the long side.
Le


QQQ: RetraceWith the rising wedge pattern forming on QQQ, I think we see a retrace to the MAs and the previous resistance at 493 to fill the gap. We have seen a huge bounce and I think we'll see some profit taking up here near the highs. The RSI has also become overbought as well, so I expect a retrace in the n

See all ideas
Summarizing what the indicators are suggesting.
Oscillators
Neutral
SellBuy
Strong sellStrong buy
Strong sellSellNeutralBuyStrong buy
Oscillators
Neutral
SellBuy
Strong sellStrong buy
Strong sellSellNeutralBuyStrong buy
Summary
Neutral
SellBuy
Strong sellStrong buy
Strong sellSellNeutralBuyStrong buy
Summary
Neutral
SellBuy
Strong sellStrong buy
Strong sellSellNeutralBuyStrong buy
Summary
Neutral
SellBuy
Strong sellStrong buy
Strong sellSellNeutralBuyStrong buy
Moving Averages
Neutral
SellBuy
Strong sellStrong buy
Strong sellSellNeutralBuyStrong buy
Moving Averages
Neutral
SellBuy
Strong sellStrong buy
Strong sellSellNeutralBuyStrong buy
Displays a symbol's price movements over previous years to identify recurring trends.
Frequently Asked Questions
An exchange-traded fund (ETF) is a collection of assets (stocks, bonds, commodities, etc.) that track an underlying index and can be bought on an exchange like individual stocks.
QQQ trades at 529.08 USD today, its price has fallen −0.98% in the past 24 hours. Track more dynamics on QQQ price chart.
QQQ net asset value is 528.96 today — it's risen 2.89% over the past month. NAV represents the total value of the fund's assets less liabilities and serves as a gauge of the fund's performance.
QQQ assets under management is 336.24 B USD. AUM is an important metric as it reflects the fund's size and can serve as a gauge of how successful the fund is in attracting investors, which, in its turn, can influence decision-making.
QQQ price has risen by 1.62% over the last month, and its yearly performance shows a 10.35% increase. See more dynamics on QQQ price chart.
NAV returns, another gauge of an ETF dynamics, have risen by 2.89% over the last month, showed a 12.74% increase in three-month performance and has increased by 12.21% in a year.
NAV returns, another gauge of an ETF dynamics, have risen by 2.89% over the last month, showed a 12.74% increase in three-month performance and has increased by 12.21% in a year.
QQQ fund flows account for 20.94 B USD (1 year). Many traders use this metric to get insight into investors' sentiment and evaluate whether it's time to buy or sell the fund.
Since ETFs work like an individual stock, they can be bought and sold on exchanges (e.g. NASDAQ, NYSE, EURONEXT). As it happens with stocks, you need to select a brokerage to access trading. Explore our list of available brokers to find the one to help execute your strategies. Don't forget to do your research before getting to trading. Explore ETFs metrics in our ETF screener to find a reliable opportunity.
QQQ invests in stocks. See more details in our Analysis section.
QQQ expense ratio is 0.20%. It's an important metric for helping traders understand the fund's operating costs relative to assets and how expensive it would be to hold the fund.
No, QQQ isn't leveraged, meaning it doesn't use borrowings or financial derivatives to magnify the performance of the underlying assets or index it follows.
In some ways, ETFs are safe investments, but in a broader sense, they're not safer than any other asset, so it's crucial to analyze a fund before investing. But if your research gives a vague answer, you can always refer to technical analysis.
Today, QQQ technical analysis shows the buy rating and its 1-week rating is buy. Since market conditions are prone to changes, it's worth looking a bit further into the future — according to the 1-month rating QQQ shows the buy signal. See more of QQQ technicals for a more comprehensive analysis.
Today, QQQ technical analysis shows the buy rating and its 1-week rating is buy. Since market conditions are prone to changes, it's worth looking a bit further into the future — according to the 1-month rating QQQ shows the buy signal. See more of QQQ technicals for a more comprehensive analysis.
Yes, QQQ pays dividends to its holders with the dividend yield of 0.56%.
QQQ trades at a premium (0.00%).
Premium/discount to NAV expresses the difference between the ETF’s price and its NAV value. A positive percentage indicates a premium, meaning the ETF trades at a higher price than the calculated NAV. Conversely, a negative percentage indicates a discount, suggesting the ETF trades at a lower price than NAV.
Premium/discount to NAV expresses the difference between the ETF’s price and its NAV value. A positive percentage indicates a premium, meaning the ETF trades at a higher price than the calculated NAV. Conversely, a negative percentage indicates a discount, suggesting the ETF trades at a lower price than NAV.
QQQ shares are issued by Invesco Ltd.
QQQ follows the NASDAQ 100 Index. ETFs usually track some benchmark seeking to replicate its performance and guide asset selection and objectives.
The fund started trading on Mar 10, 1999.
The fund's management style is passive, meaning it's aiming to replicate the performance of the underlying index by holding assets in the same proportions as the index. The goal is to match the index's returns.