NVDA trade ideas

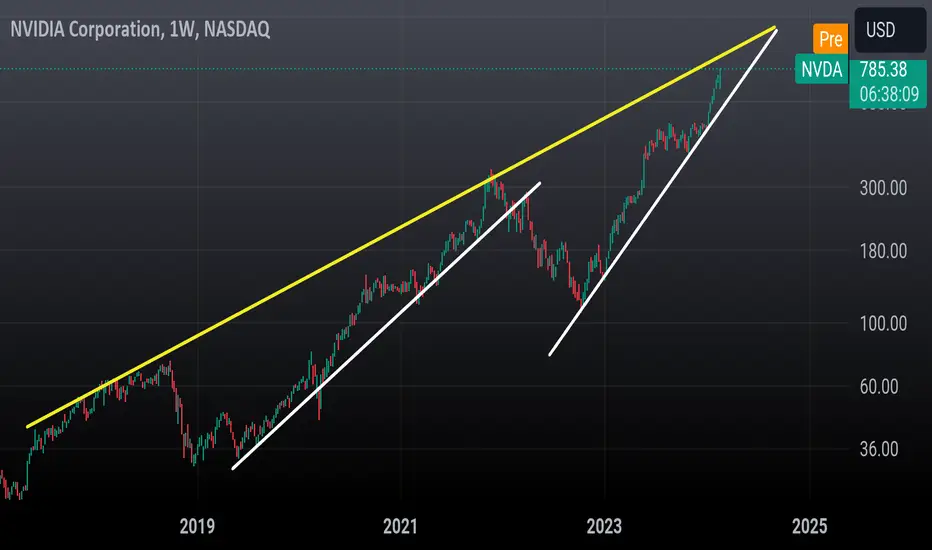
nvidiajust drawing breakout levels in Nvidia Stock, I am just sharing my view no buy sell idea on Nvidia

The NVidia Party About to PopNVidia left behind a yawning gap, it is now testing the support formed after that gap, the price point of failure is $403.11, if we go lower than that we have higher conviction that we drop to fill the gap. For now indicators show it is oversold so we can expect a bounce which I would expect to be rejected at the intersection of horizontal resistance and median line of Pitchfork.

Can Nvidia Go Higher?In early-January we published a Breakout Alert highlighting Nvidia’s breakout from a long-term consolidation phase. Nearly two months on, the shares have surged 59% and we’re now left asking, can Nvidia go higher?
Nvidia’s Quarterly Numbers: A “tipping point” in the AI Revolution
Last week’s colossal quarterly update from Nvidia represents a self-proclaimed “tipping point” in the AI revolution.
The $22.1 billion in quarterly revenues, a staggering 265% increase, far exceeding Wall Street predictions, is not merely a financial achievement for Nvidia but a testament to the seismic shift happening in the tech landscape.
Nvidia’s founder and CEO, Jensen Huang, didn’t mince his words when he declared, “Accelerated computing and generative AI have hit the tipping point.” This statement encapsulates a pivotal moment where the demand for AI technologies has surged globally, creating an unprecedented frenzy.
On the back of the market-beating numbers, Nvidia’s share price gapped higher again – reigniting the stocks powerful uptrend.
Signs of Exhaustion Creeping In
The Breakout Alert we published in early-January highlighted several reasons why Nvidia’s breakout was likely to sustain, including the prolonged period of consolidation prior to the breakout, the strong close backed by rising volume, and the long-term uptrend.
However, with prices more than 20% above the volume weighted average price (VWAP) anchored to the January breakout, there are signs that trend exhaustion is creeping in.
1. Bearish ‘Gap and Give’:
On Friday, Nvidia’s share price gapped outside the upper Keltner Channel only to close lower on the day – forming a ‘gap and give’ pattern which signals exhaustion. This has been followed by a small inside day. A break below the inside day lows could trigger a deep pullback.
2. RSI Divergence:
The RSI being technically ‘overbought’ is nothing new to Nvidia. The RSI stands for Relative Strength Index and there a no better stocks at demonstrating relative strength than Nvidia. However, in recent weeks, the shares have been making higher highs, but the RSI has been making lower highs – negative divergence. This is signals that the trend is potentially running out of momentum.
3. Falling Volume:
We have seen quite a significant drop in volume since last week’s quarterly numbers. This isn’t a standalone indication of exhaustion, but when viewed within the context of the other factors it adds to the picture of waning appetite to drive prices higher.
NVDA Daily Candle Chart
Past performance is not a reliable indicator of future results
Disclaimer: This is for information and learning purposes only. The information provided does not constitute investment advice nor take into account the individual financial circumstances or objectives of any investor. Any information that may be provided relating to past performance is not a reliable indicator of future results or performance. Social media channels are not relevant for UK residents.
Spread bets and CFDs are complex instruments and come with a high risk of losing money rapidly due to leverage. 84.01% of retail investor accounts lose money when trading spread bets and CFDs with this provider. You should consider whether you understand how spread bets and CFDs work and whether you can afford to take the high risk of losing your money.

How to use call option buy or sell indicatorHello Traders,
Exciting news! We've just released a detailed video guide on how to harness the full potential of Chobotaru Brothers Option Indicators. In this short tutorial, we cover everything you need to know to use the indicator, specifically focusing on out-of-the-money call options.
Here's what you'll discover in the video:
1. Adding the Indicator to Your Chart:
Learn the simple steps to seamlessly integrate Chobotaru Brothers Option Indicator into your trading view for a clear and concise analysis.
2. Finding Option Parameters:
Navigate through your broker's option chain on platforms such as Interactive Brokers to locate all the essential parameters needed for effective trading decisions.
3. SEE the Lines of Profit:
Gain a deep understanding of the meaning behind each line of profit displayed by the indicator, empowering you to make informed choices based on market movements.
4. Utilizing Lower Timeframes (Example of 5m and 30m):
Explore the versatility of Chobotaru Brothers Option Indicator by discovering how it can be effectively applied to lower timeframes like 5 minutes and 30 minutes.
5. LIVE Example: Out-of-the-Money Call Option:
Follow along with our real-time example using an out-of-the-money call option, providing practical insights into how EASY is the indicator's functionality and application in a live trading scenario.
We've designed this tutorial to be beginner-friendly, ensuring that traders of all levels can seamlessly integrate Chobotaru Brothers Option Indicators into their trading arsenal. Watch the video, enhance your trading skills, and unlock the potential for greater success in the options market.
If you find the video helpful, don't forget to like, follow, and share it with your fellow traders. Happy trading, and may your profits soar!
Best regards,
Chobotaru Brothers

NVDA - The Trend Is Your FriendPretty incredible chart. This price action will be talked about for years. Where will it end? How will it end? These are not questions I know how to answer. The great thing is I don't have to know the answers to these questions to profit MAJORLY from the price action. Everything I need to know is reflected in the price action.
The trend is your friend (until the end). #NVDA

Nvidia Near an Intermediate TopNvidia (NVDA) is probably the most powerful U.S. stock and could make a significant top weeks after the main U.S. stock indices peak.
Elliott wave analysis indicates an intermediate top could soon occur, then a correction before a 5th wave advance. Perhaps near 1,000.
Weekly RSI supports this theory, usually stocks and stock indices have at least one RSI bearish divergence before making a significant top. Currently NVDA is at its maximum weekly RSI reading.


Nvidia Could Ultimately Crash the US Stock MarketRarely do you see a "Blow Off Top" in play like
what you are seeing in Nvidia (NVDA),
with a current valuation of 2 Trillion US Dollars.
Think about that for a moment
The mania of AI, or Artificial Intelligence has taken now over the world
as the biggest technology creation of the twenty first century.
Bubbles in the stock market occur,
when mass belief, ultimately turns into tragic disbelief.
My own personal belief is that ultimately Nvidia stock will crash back to earth
like every other stock bubble created by capitalism before.
However in this case, Nvidia could also be responsible
for a shocking crash in the US stock market. if things suddenly unwind.
As a trader, I am watching the 750 price level in Nvidia,
which is the price level where it opened on the NYSE on Feb.22,2024,
after its blow out earnings.
There is a 75 point upside gap,from 750 down to 675,
10 % that needs to be filled immediately if support at 750 breaks.
If "artificial intelligence" computers decide to sell all at once,on a break of 750
perhaps now you might understand,... what could happen next.
NVDA 788.17 Last.
THE_UNWIND
WOODS OF CONNECTICUT

NVDA due for a massive correction The Monthly RSI has just had its second Peak after the main peak. Not saying this week or next month, but she will fall, and alot. $400 is my starter target. Ultimatlly $315 would be sweet.
Looking for a top of around $860. Remember this is taken off the Monthly, so this could take up to a year to happen.
The white dotted line is the Overall trend. We are to far away from our 200 EMA's. People will take profits here.

Nvidia Hype is Done NVIDIA appears poised for a downturn, having seemingly exhausted the momentum from the AI hype. The stock might be entering a distribution phase, indicating a cooling interest that could lead to a short-term downtrend. According to Fibonacci retracement analysis, a key target for this downtrend is the 0.618 level, equating to a price of $625, expected to be reached before the summer. Factors contributing to this potential decline include market saturation in AI technologies, increased competition, and possibly overvalued stock prices relative to earnings potential. Always consider consulting with a financial advisor for personal investment decisions.

NVIDIA technical analysisAnalyzing NVIDIA we can see a complex market picture. The large Elliott waves (orange) indicate five primary price movements, with three being impulsive waves upward (1, 3, 5) and two corrective waves (2, 4). The smaller Elliott waves (white) represent sub-waves within the larger upward trend of wave (5).
Potential support at a yellow channel, which is aligned with previous troughs and peaks, suggesting it's a significant level for future price action. The correction that may occur is suggested by the Fibonacci levels drawn on the last impulse of wave (5). The 0.5 Fibonacci level, often acting as a significant retracement level, points to a potential support area around $600.76, while the 0.618 Fibonacci level indicates a price around $554.92.
Cumulative volume showing increased activity during rises and falls, might indicate the strength or weakness of the price movement. Increased volume during the last upward impulse may suggest solid buying interest at these price levels.
With these observations in mind, it appears that if a correction occurs, we could look for support along the yellow channel and the indicated Fibonacci levels. Considering the market dynamics and historical price behaviors, these areas might offer potential reversal points for further price movements.

NVDALog chart here.. Logarithmic is good for charting parabolic moves...
Approaching 6yr resistance around 860-875... I expect a pullabc there to support
Around 650-700 before the last leg up to 1000
Ready for a pullback?I'm looking for a wave 4 pullback that will last several months. Then a final wave 5 taking the price to over $900. Under $600, then it would probably mean wave 5 has already completed.

NVDA NVIDIA Corporation Options Ahead of EarningsIf you haven`t bought NVDA before the previous earnings:
Then analyzing the options chain and the chart patterns of NVDA NVIDIA Corporation prior to the earnings report this week,
I would consider purchasing the 710usd strike price Calls with
an expiration date of 2024-2-23,
for a premium of approximately $48.65.
If these options prove to be profitable prior to the earnings release, I would sell at least half of them.

NVDIA= Who likes artificial intelligence?Hello ;the buying pressure is so strong that I don°t see how nvdia will avoid the 1000 token

A top in $NVDA? I know it is very brave of me to call a top in NASDAQ:NVDA here with all is going on in AI right now. But I can only analyse what the market is telling me right now.
And the market is telling me that a top might be in place. And here are 5 reasons why :
1. Fibonacci golden ratio on a weekly timeframe we are almost there. We see how the golden ratio it's splitting the 5 waves impulse up.
Even in Wave 5 we have a Fibonacci Golden ratio. This time is 0.618/0.382. They all point out to the same zone.
2. Bearish divergence between the price and MACD- Histogram and MACD lines
3.Kangaroo tail
The last bar is a sign of worry for the bulls.
4. Outside upper channel line
5. Quite a gap to the value zone. Which on a daily is between $675-$716.
and as bonus reason Steve Weiss just bought NASDAQ:NVDA
Of course there are a few reasons for the bulls as well. and NASDAQ:NVDA could go to the Moon.
What do you think. Bull or bear here?
Legal Disclaimer: The information presented in this analysis is solely for informational and educational purpose and does not serve as financial advice.

Approaching A Top Soon...Yes topping range is quite wide but I believe it can happen soon (within weeks-months) - There is also the chance it's topping out now. I would not be shorting just yet...I would be waiting until it becomes more obvious and we have a defined top and a rally failing to break that top.

a weekly price action market recap and outlook - nvidia #3Good evening and i hope you are well.
Last time i talked about Nvidia was 3 week ago and Nvidia at 661. Time to revisit and adjust again.
I said buy, 700 and even 800 were my targets. Market kept at it, 788 now with 823. If you made money, please leave a comment, thumps up or whatnot. I hope you enjoyed it.
Outlook
Quote from last outlook: "The thing about FOMO rallies is, no one knows where it will end and it can go so much higher and longer than anyone would have ever guessed."
If you don't think this stock is a bubble, you have not been paying enough attention to bubbles and the financial markets as whole. But it's alright, as long as you make money, no one cares.
Only question is, when will it burst. I explained my reasoning why it will continue to go up and if it stops, it might go down hard because so many people want to save their gains.
bull case: 800 was my rough target based on some measured moves, it's a big round number and market did what it had to. Good profit taking there too. Now what possibly can the reason for the bulls be to buy this? Well, it's only going up and trend is your friend. Does that mean it's smart to buy at upper trend lines, fulfilled measured move targets and what have you? No. It's plain freaking dumb from a risk:reward perspective. The next reasonable targets are 900 and 1000. I just won't try to come up with reasoning from a price action perspective here, sorry.
bear case: I did not touch any of the lines drawn 3 weeks ago. Last week we had a pullback for 10% and this week another run for 25% up. This is peak insanity of a stock and we are very close to the end. No one want's to be left holding the bag and the next pullback will be a deeper one. For that to happen, the overall market has to weaken and since we are still making new ath's evey week, no reasoning for a short here anyhow. If you dare, wait for weakness and then sell small. The risk:reward is on your side if bears can get something going, which odds favor after such a buy climax. If bears are strong, their first target should be 670.
short term: stock is just going up and that's why the probability of it continuing, is higher than sideways or down. does that mean you should buy? no. risk:reward is on bear side and for that we need to see weakness and consecutive bear bars closing on their lows. so even probability is low, one should look for weakness and sell it small.
medium-long term: bubbles burst eventually and when they do, market overshoots to the downside as well before osciallating around the fair price (average price). what will that be? who the f knows. if this stock does not lose at least 40% this year, i have to rethink my life choices very hard.
Have a great weekend

Nvidia Bounce TrackWhile the main scenario for this stock implies a further advancement in price considering the importance of its product(s) in AI development and deployment, this project attempts to anticipate or "catch", a significant reversal signal, preferably with a candlestick shadow at one of the shapes (similar to the examples highlighted in past price action). 2 other relevant occurrences might pop somewhere else in the snapshot, without shadows, but with other candlestick patterns.
A reversal of a wave (:no matter how big or small), provides a strategic entry relative to the context of the market or the context of future potential scenarios, having a tight exit strategy (above the high or in this case below the low of the signal candle), while being open to higher rewards relative to risk.
This Simulation of potential future scenarios, resulting in a hybrid design that takes into account at least 10 such main scenarios, has been carefully selected, processed, and applied, with alien nen technology and mechanisms, brought to you from the depths of a Black Hole, where time and space collapse into a wonder of oneness and transcendence, called Singularity.

nvidia ai hypestrong hands hold> more upside coming for nvidia they have 95 % ai market in there hands new launce for ai chips in q2 coming ai hype every one wants the nvidia chips.

NVIDIA $NVDA - Feb. 22nd, 2024NVIDIA NASDAQ:NVDA - Feb. 22nd, 2024
BUY/LONG ZONE (GREEN): $661 - $810
DO NOT TRADE/DNT ZONE (WHITE): $609 - 661
SELL/SHORT ZONE (RED): Not Shown
Weekly: Bullish
Daily: Bullish
4H: Bullish
Not much to say, earnings and momentum speak for themselves, just thought I'd quickly throw up what I have drawn as support areas for bulls and a profit target. The target shown is roughly a +20% gain from the start of the bullish zone where my entry is it. No short zone is drawn as I do not believe something so strongly bullish should be considered for a short at this time.
This is what I would personally look at before entering trades, everything is subject to change on a daily basis and as I analyze different timeframes and ideas.
ENTERTAINMENT PURPOSES ONLY, NOT FINANCIAL ADVICE!

nvda weekly 9 coming on TDIWeekly 9 coming on a 2 week time span. It has been a good indicator for pullbacks / consolidation. NVDA could see some chop as it did in the last 9 or more off a pullback to the uptrend. Just something to keep in mind.
