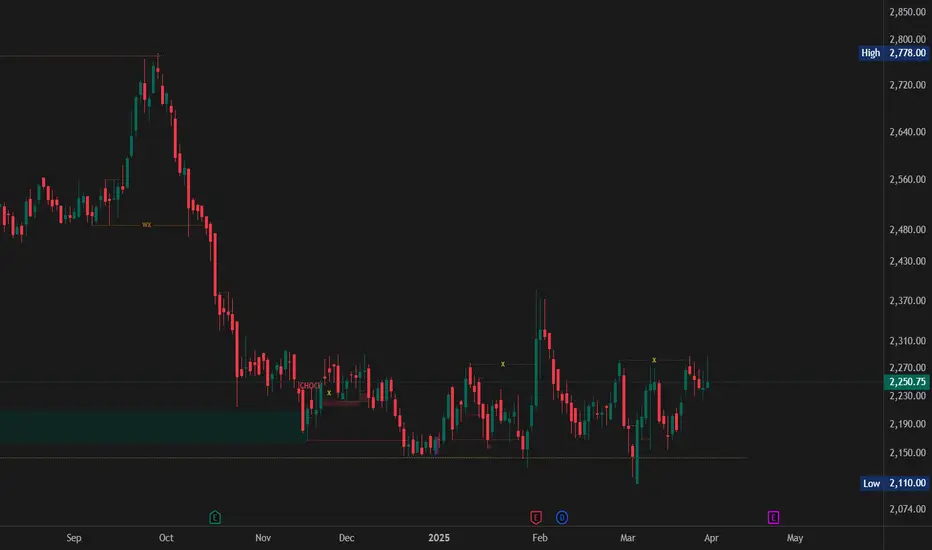
NESTLEIND - Range Bound -Box BreakOut -DailyThis is a technical analysis chart of **Nestle India Ltd. (NSE: NESTLEIND)** on a **daily timeframe**, and here's a breakdown of what it's showing:
---
### 📊 **Price Action and Pattern**
- **Range Bound (Accumulation)**: From around **November 2024 to mid-April 2025**, the price was consolidating
Next report date
July 24
Report period
Q1 2025
EPS estimate
8.51 INR
Revenue estimate
51.74 B INR
33.25 INR
32.08 B INR
202.02 B INR
357.60 M
About NESTLE INDIA LTD
Sector
Industry
CEO
Suresh Narayanan
Website
Headquarters
Gurgaon
Founded
1912
ISIN
INE239A01024
FIGI
BBG000CX27Y8
Nestlé India Ltd. engages in the manufacture and sale of food products. The firm offers beverages; breakfast cereals; chocolates and confectionery; dairy; nutrition; foods; vending and food services; imports; exports; and Nestle ad campaigns brands. It operates through the India and Outside India geographical segments. The company was founded in 1912 and is headquartered in Gurgaon, India.
10%
12%
14%
16%
18%
Q4 '23
Q1 '24
Q2 '24
Q3 '24
Q4 '24
0.00
15.00 B
30.00 B
45.00 B
60.00 B
Revenue
Net income
Net margin %
Revenue
COGS
Gross profit
Op expenses
Op income
Non-Op income/ expenses
Taxes & Other
Net income
0.00
15.00 B
30.00 B
45.00 B
60.00 B
Revenue
COGS
Gross profit
Expenses & adjustments
Net income
0.00
15.00 B
30.00 B
45.00 B
60.00 B
Q4 '23
Q1 '24
Q2 '24
Q3 '24
Q4 '24
0.00
3.00 B
6.00 B
9.00 B
12.00 B
Debt
Free cash flow
Cash & equivalents
No news here
Looks like there's nothing to report right now

Nestle Crossing 200 EMASince FMCG Sector are defensive sector and moves aggresivly when market falls.
Nestle after a long consolidation near the support area broke out the 200 EMA and now ready to move for a uptrend.
Note: May not expected super rally if market moves rapidly because during bull markets, FMCG might underpe

Nestlé India – Strong Buy Opportunity After 25% Correction! 🔎 Market Overview & Technical Structure
Nestlé India has undergone a significant 25% correction from its all-time high, presenting a strategic investment opportunity. The stock has recently swiped a key monthly swing low and is now showing signs of potential upside movement.
📉 Stock Correction from
Nestle - Long term Bottom formation and Breakout for investmentSupport b/w 2100-2150 since Dec 24 has been holding
50 month SMA at 2106— very strong & rarely breaks
200 week SMA rarely breached & now at 2132
Moving averages: Crossed 20/50/100 day SMA
MACD: Daily +ve, Weekly +ve, Monthly -ve
Daily CCI > 100 (bullish)
Resistance Levels:
- 2280 (range)
- 23

Accumulate for Long TermNestle is trading at a little discount as compared to it's historic valuation for last 6-7 years. This is a growing stock, so it will be good to buy some shares now. Some details of it's strategies and products portfolio below - Happy Trading :)
Over the past six to seven years, Nestlé India has de


Nestle Buy At This Level 22221. **Nestlé India Ltd.** is a leading food and beverage company, a subsidiary of the Swiss multinational Nestlé.
2. Established in 1961, the company is headquartered in Gurugram, Haryana.
3. It is known for popular brands like Maggi, Nescafé, KitKat, and Milkmaid.
4. Nestlé India focuses on nu

Nestle swing tradingAll is well
Good day
Just my view and educational purposes only I'm not a SEBI registered advisory...trade on your own risk.
This is simple ORB Strategy with volume breakout..i will enter EOD 3.25pm if the price trade above the blue line and after entry I will wait for my target or stoploss (D cand

NESTLEIND buying opportunityPrice is showing a positive reaction from the institutional buying zone, suggesting a potential buying opportunity at the levels indicated in the chart.
NESTLEIND presents a strong opportunity for both short-term and long-term gains.
Please note: I am NOT a SEBI-registered advisor or financial

See all ideas
Summarizing what the indicators are suggesting.
Neutral
SellBuy
Strong sellStrong buy
Strong sellSellNeutralBuyStrong buy
Neutral
SellBuy
Strong sellStrong buy
Strong sellSellNeutralBuyStrong buy
Neutral
SellBuy
Strong sellStrong buy
Strong sellSellNeutralBuyStrong buy
An aggregate view of professional's ratings.
Neutral
SellBuy
Strong sellStrong buy
Strong sellSellNeutralBuyStrong buy
Neutral
SellBuy
Strong sellStrong buy
Strong sellSellNeutralBuyStrong buy
Neutral
SellBuy
Strong sellStrong buy
Strong sellSellNeutralBuyStrong buy
Displays a symbol's price movements over previous years to identify recurring trends.
Curated watchlists where NESTLEIND is featured.

Frequently Asked Questions
The current price of NESTLEIND is 2,413.50 INR — it has decreased by −0.81% in the past 24 hours. Watch NESTLE INDIA LTD stock price performance more closely on the chart.
Depending on the exchange, the stock ticker may vary. For instance, on NSE exchange NESTLE INDIA LTD stocks are traded under the ticker NESTLEIND.
NESTLEIND stock has risen by 1.75% compared to the previous week, the month change is a 7.03% rise, over the last year NESTLE INDIA LTD has showed a −4.22% decrease.
We've gathered analysts' opinions on NESTLE INDIA LTD future price: according to them, NESTLEIND price has a max estimate of 2,825.00 INR and a min estimate of 2,055.00 INR. Watch NESTLEIND chart and read a more detailed NESTLE INDIA LTD stock forecast: see what analysts think of NESTLE INDIA LTD and suggest that you do with its stocks.
NESTLEIND reached its all-time high on Sep 27, 2024 with the price of 2,778.00 INR, and its all-time low was 229.50 INR and was reached on Apr 23, 2010. View more price dynamics on NESTLEIND chart.
See other stocks reaching their highest and lowest prices.
See other stocks reaching their highest and lowest prices.
NESTLEIND stock is 2.01% volatile and has beta coefficient of 0.82. Track NESTLE INDIA LTD stock price on the chart and check out the list of the most volatile stocks — is NESTLE INDIA LTD there?
Today NESTLE INDIA LTD has the market capitalization of 2.33 T, it has increased by 2.32% over the last week.
Yes, you can track NESTLE INDIA LTD financials in yearly and quarterly reports right on TradingView.
NESTLE INDIA LTD is going to release the next earnings report on Jul 24, 2025. Keep track of upcoming events with our Earnings Calendar.
NESTLEIND earnings for the last quarter are 9.18 INR per share, whereas the estimation was 8.47 INR resulting in a 8.42% surprise. The estimated earnings for the next quarter are 8.51 INR per share. See more details about NESTLE INDIA LTD earnings.
NESTLE INDIA LTD revenue for the last quarter amounts to 55.12 B INR, despite the estimated figure of 55.11 B INR. In the next quarter, revenue is expected to reach 51.74 B INR.
NESTLEIND net income for the last quarter is 8.73 B INR, while the quarter before that showed 6.88 B INR of net income which accounts for 26.95% change. Track more NESTLE INDIA LTD financial stats to get the full picture.
NESTLE INDIA LTD dividend yield was 1.20% in 2024, and payout ratio reached 81.15%. The year before the numbers were 0.00% and 0.00% correspondingly. See high-dividend stocks and find more opportunities for your portfolio.
EBITDA measures a company's operating performance, its growth signifies an improvement in the efficiency of a company. NESTLE INDIA LTD EBITDA is 48.38 B INR, and current EBITDA margin is 24.01%. See more stats in NESTLE INDIA LTD financial statements.
Like other stocks, NESTLEIND shares are traded on stock exchanges, e.g. Nasdaq, Nyse, Euronext, and the easiest way to buy them is through an online stock broker. To do this, you need to open an account and follow a broker's procedures, then start trading. You can trade NESTLE INDIA LTD stock right from TradingView charts — choose your broker and connect to your account.
Investing in stocks requires a comprehensive research: you should carefully study all the available data, e.g. company's financials, related news, and its technical analysis. So NESTLE INDIA LTD technincal analysis shows the buy rating today, and its 1 week rating is buy. Since market conditions are prone to changes, it's worth looking a bit further into the future — according to the 1 month rating NESTLE INDIA LTD stock shows the buy signal. See more of NESTLE INDIA LTD technicals for a more comprehensive analysis.
If you're still not sure, try looking for inspiration in our curated watchlists.
If you're still not sure, try looking for inspiration in our curated watchlists.