Technical Analysis of NEXO/USDT (Weekly Timeframe)Pattern and Structure:
The chart displays a harmonic pattern, possibly a Gartley or Bat formation, with the key points X, A, B, C, and D marked.
A broadening wedge (or expanding triangle) is also forming, showing increasing volatility.
Key Price Levels
Current Price: $1.423
Resistance Zone: $1

NEXO Cup and Handle PatternNEXO looks very good to breakout of the Cup and Handle pattern which is very visible on the 1week and 1month TF. Price is above the 20 MA on the Weekly TF.
It has been trending for awhile now but it's yet to make a big move. Cup and Handle breakout is always big.

TradeCityPro | Navigating NEXO's Financial Waters👋 Welcome to TradeCityPro!
In this analysis, I want to discuss the NEXO coin for you. The NEXO project is a payment platform. This coin has always had issues with the US government and has been involved in several legal cases, but now, with Trump as president, it's experiencing a more relaxed envir

NEXO breaking outNexo the only lending platform to survive the 2021 collapse. Very strong momentum, lots of new features released and trust from its customers.
Gossip is: they are coming back to the US market.

NEXO Technical Analysis in Daily TimeframeHello everyone, I’m Cryptorphic.
For the past seven years, I’ve been sharing insightful charts and analysis.
Follow me for:
~ Unbiased analyses on trending altcoins.
~ Identifying altcoins with 10x-50x potential.
~ Futures trade setups.
~ Daily updates on Bitcoin and Ethereum.
~ High time frame (H

NEXO/USDT I BUY SETUP✔︎📈 BINANCE:NEXOUSDT SIGNAL
✔︎ENTRY : 1.462
🏓TARGETS :
✔︎ T1 : 1.660
✔︎ T2 : 1.859
✔︎ T3 : 2.103
✔︎ Long term T4 - T5
✘ STOP : 1.360
🚦Stop Trigger:
• If you make capital management: Stop is activated when one candle opening and closing
below the stop level of the same time frame of the signal.

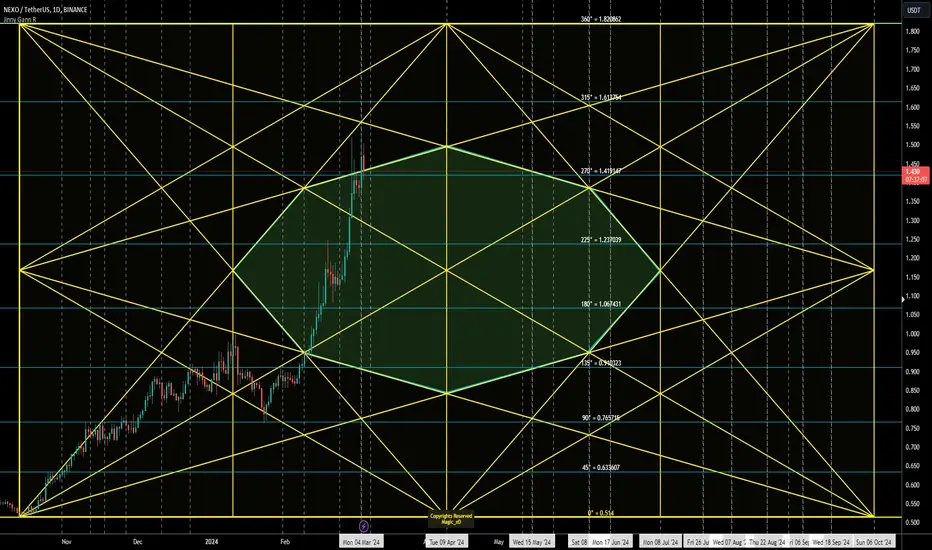
Nexo - Jinny Gann levels / StarNexo Reversal dates on chart
Expected Cycle top @ 1.82
horizontal lines are Support/Resistance .
Vertical lines are time pivots .
The most accurate Gann tools here.
Jinny Gann
Appreciate your Comments.
GL
NEXO on its way to $3I tentatively assume that we will reach $1.3 with NEXO, then around $3, and if successful, a peak around $4

Nexo showing a very professional Accumulation phase Hi Everyone;
today we have one of the Interesting coin.. NEXO
My TA showing almost 23 Risk to rewards, but looking to the accumulation phase I expect more than that, let's give it a chance.

#NEXO/USDT - Long - Potential 21.68%
Strategy: Long
Exchange: BYBIT
Account: Spot
Entry mode: Market order in range
Invest: 5%
Exit:
• Target 2 : 1.1 20.32%
• Target 1 : 1.012 11.72%
Entry: 0.9142 ⌁ 0.9142
• Current market price: 0.9142
• Stop: 0.812 (-11.18%)
Technical indicators:
Resistance break in confirmed uptrend. Dip into l

See all ideas
Displays a symbol's price movements over previous years to identify recurring trends.
Frequently Asked Questions
The current price of NEXO / Tether US (NEXO) is 1.3622 USDT — it has fallen −1.38% in the past 24 hours. Try placing this info into the context by checking out what coins are also gaining and losing at the moment and seeing NEXO price chart.
NEXO / Tether US price has risen by 2.10% over the last week, its month performance shows a −1.05% decrease, and as for the last year, NEXO / Tether US has increased by 26.54%. See more dynamics on NEXO price chart.
Keep track of coins' changes with our Crypto Coins Heatmap.
Keep track of coins' changes with our Crypto Coins Heatmap.
NEXO / Tether US (NEXO) reached its highest price on Mar 13, 2024 — it amounted to 1.5886 USDT. Find more insights on the NEXO price chart.
See the list of crypto gainers and choose what best fits your strategy.
See the list of crypto gainers and choose what best fits your strategy.
NEXO / Tether US (NEXO) reached the lowest price of 0.5161 USDT on Oct 12, 2023. View more NEXO / Tether US dynamics on the price chart.
See the list of crypto losers to find unexpected opportunities.
See the list of crypto losers to find unexpected opportunities.
The safest choice when buying NEXO is to go to a well-known crypto exchange. Some of the popular names are Binance, Coinbase, Kraken. But you'll have to find a reliable broker and create an account first. You can trade NEXO right from TradingView charts — just choose a broker and connect to your account.
Crypto markets are famous for their volatility, so one should study all the available stats before adding crypto assets to their portfolio. Very often it's technical analysis that comes in handy. We prepared technical ratings for NEXO / Tether US (NEXO): today its technical analysis shows the buy signal, and according to the 1 week rating NEXO shows the strong buy signal. And you'd better dig deeper and study 1 month rating too — it's strong buy. Find inspiration in NEXO / Tether US trading ideas and keep track of what's moving crypto markets with our crypto news feed.
NEXO / Tether US (NEXO) is just as reliable as any other crypto asset — this corner of the world market is highly volatile. Today, for instance, NEXO / Tether US is estimated as 0.76% volatile. The only thing it means is that you must prepare and examine all available information before making a decision. And if you're not sure about NEXO / Tether US, you can find more inspiration in our curated watchlists.
You can discuss NEXO / Tether US (NEXO) with other users in our public chats, Minds or in the comments to Ideas.