airtel triangle waveAirtel will reach high at 588 and will again his supportNby Guru7208Updated Jul 15, 20205
Bharti showing Cup & Handle with Ascending Triangle formationLet me know your views. On the daily timeframe Bharti shows a Cup and Handle pattern over 2 years and is near a breakout. Its currently in an Ascending Triangle formation with breakout above 590.NLongby KumarMiteshUpdated Jul 14, 20205
Bharti ARTL price at Resistance wait for price to close above resistance this is looking perfect bullish to me. and off course i am bullish in this oneNLongby akashinvestorJul 14, 20209
BHARTI AIRTEL...WHAT IS PERFECT ENTRY...FULL LONG CHART ANALYSISBHARTI AIRTEL...WHAT IS PERFECT ENTRY...FULL LONG CHART ANALYSISNLongby vijay24febJul 5, 20204
Resistance should become weak now #Nifty Bharti Airtel has been trading now for quite some time in range and has tested its resistance multiple time which makes now the resistance weak, just with little volume support it will be ready to heads towards its next Resistance Level No.2 NLongby Graj88Jul 13, 20207
BHARATI AIRTEL 15MNBEARISH Deep Crab for SCALPING price need to follow Green Trend line & hit target If price Breaks Red Trend line is where EXIT before SL hits POTENTIAL SELL Price Breaks Red Trend line considering ABSORPTION Volumes + BREAKS OUT Scalping BUY is good probability NShortby PriceActionTradervsaJul 13, 20203
BHARATI AIRTEL 1HRBEARISH BAT Will price come into PRZ Zone of Bat Pattern Or as it being a TYPE2 Entry for BEARISH AB=CD can we expect REVERSAL from AB=CD with LOW VOLUMES & confirmation from a BEARISH CANDLE with RSI Below 70 POTENTIAL SELLNShortby PriceActionTradervsaJul 13, 20205
BHARATI AIRTEL 15MNBEARISH Deep Crab for SCALPING HIGH VOLUME for going SHORT we need LOW VOLUMES in the area of ULTRA HIGH VOLUME Bars price need to Come into PRZ ZONE then with confirmation from a BEARISH CANDLE with RSI Below 70 POTENTIAL SELLNShortby PriceActionTradervsaJul 12, 20206
BHARATI AIRTEL 4HRBEARISH BAT ......If price breaks Symmetric Triangle to UP expecting price to Retest Bat PRZ POTENTIAL SELLNShortby PriceActionTradervsaJul 12, 20204
Long Bhartiartl With Stoploss of 560.15 and Target 577Long Bhartiartl With Stop-loss of 560.15 and Target 577.. We are not SEBI registered and this is only for educational purpose..NLongby Kirtissh_MarkUpdated Jul 10, 20207
RansomMultiyear breakout on monthly. Nice base formation around ATH region. Waiting for close above 590NLongby mehulsan77Jul 9, 20201
584 ABOVE IT CAN BUY FOR 640 LEVEL WITH STRICT SL 569JUST FOR EDUCATION PURPOSE NOT FOR ANY BUY OR SELLNLongby uday123srtUpdated Jul 7, 20204
BHARTI AIRTEL ANALYSISWATCH THE CHART AND UNDERSTAND IT BEFORE TRADING!NShortby Nikunj_BangadUpdated Jul 7, 20203
BHARTI AIRTEL MULTI TIME FRAME ANALYSIS Comment your ideas about this trade! Thankyou for watchingN04:55by TechnicalGurukulJul 6, 20203
Bharti Airtel - Long Setup - Shakeout of Weak Longs?NSE:BHARTIARTL long setup. Keep track of this. If it resumes uptrend, then it will zoom fast as today's action looks like week longs shakeout.NLongby akashboddedaJul 6, 20203
Bharti Airtel on fireBhartiairtel broken daily trendline and buy RSI is at high trendline. If RSI trendline broken then a sharp rally can be seen . else it will retrace till 276-273 and that would be entry point. Targets on chartNLongby IndyanUpdated Jul 6, 20205
Flag Breakout In Bharti Airtel .Flag Breakout IN Bharti Airtel Buy Above 585 .NLongby veenshJul 6, 20203
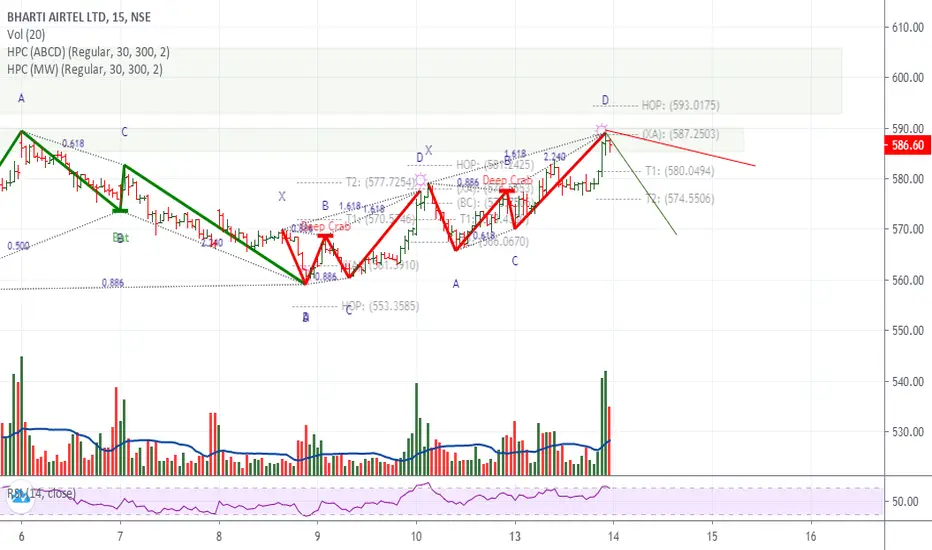
Bharti Airtel Ltd (Bhartiartl - NSE) Bulls or bears - who win ?Bharti Airtel Ltd (Bhartiartl - NSE) has completed impulse wave up as C in 4 hr time frame and now it is correcting down side. Here two counts possible, where one is either WXY complex correction, where Y wave down is in progress as in wxy in which y wave will start moving down. Alternatively triangle possible, which is about to break upside, where invalidation level of 588.10 is crucial, because above that level stay bullish only for new high and big upmove. But below that level stay bearish for down cycle, which probably ends near 520-30 level. NShortby EWFcwJul 6, 20203
Accumulation analysis on BHARTIAIRTEL, Waiting for a POP !Bhartiairtel is near to its resistance line(blue) which it most like would break and can give upside spurt.NLongby Pivotal_TradersJul 5, 20204
Airtel is BullishAirtel is looking good. Monthly chart shows it's above the 2007 high and sustaining that level from the month of May 2020. Yellow line signifies the breakout on monthly basis and looks like a decent up-move possible. NLongby TRD35Jul 5, 20202