A very interesting formation in HDFC FEB futures chart. A three drive pattern failure followed by the formation of Head and Shoulders and the price broke down below the neckline. This is indicating a strong bearish move with downside momentum below 1690 courtesy confluence of bearish signals.
HDFCBANK1! trade ideas


Hdfc bank upside pushHdfc bank showing backbone here n may push itself for an upside which can soon cross 1500-1600-1700 from here.
Strong economic data will also help.
Rupee going to get benefit from dollar as rate cut in 2nd half of the year will definitely boost growing economy.
expecting 25-35% gain in coming months. Which is 400-500+ pts upside.
Let's see.

HDFC Bank - High probability stock can move up now. Though the pain is not complete, atleast it looks like downside in HDFC Bank is coming to an end . 1371 should be the low for now. We should see a rally soon with 1st tgt being 1458, 2nd tgt being 1515 and 3rd tgt being 1573. I would urge people can go long now with SL at 1371 on candle closing basis on 1 Day chart.


HDFC BANKHdfc Bank making a poll and flag pattern in 1hr time frame if we put a fib retracement than we saw stock taking rejection at .5 and .618 area multiple times and if today stock gives a breakdown and sustain below trendline and previous low our targets are bottom and fib levels 1550,1540,1500

HDFCBANK1!01-12
Daily chart of HDFCBANK1!
LTP: 1638.25
The candles are respecting the resistance (manual) between 1643 and 1645. This zone looks strong and it won't be easy to break and sustain above this.
The supports are at 1515 (manual) and 1470.45 (200 EMA)
RSI is bearish and shows a bearish divergence as well. This means that the stock is not losing strength.
The longer trend is bullish as the candles are trading above 200 EMA but swing traders can go short here.

HDFC Bank Levels & StrategyDear traders, I have identified levels based on my analysis, major support and resistance levels. Please note that I am not a SEBI registered member. Information shared for educational purpose. Please do take trade based on your own analysis and risk-taking abilities. Never ever worked with fixed mindset. Any news/result data may change the direction of the trend instantly. Focus on learning so you can take correct/better decision based on your analytical skills. PLEASE NOTE THAT NO ONE CAN BE 100% CORRECT EXCEPT GOD. OVERALL, WE SHOULD BE ABLE TO CLOSE IN PROFIT EVEN IF WE ARE 50% CORRECT WITH RISK REWARD RATIO 1:2.
Will HDFC Bank breakout above important resistance zone and continue to move-up?
OR
Profit Booking will bring down HDFC Bank to near major support levels?

HDFC Bank Futures Key Trading Levels for 28th June 2022HDFC Bank Futures Key Trading Levels for 28th June 2022
Disclaimer: These levels are purely based on Price action/demand and supply zones & and consumed only for educational purpose & should not be taken as buy/sell recommendation. I will not be responsible for any loss/profit incurred if anyone takes trades based on my views.
Please consult your Financial Advisor before making any trading decision.
Leave a comment that is helpful or encouraging. Let's master the markets together.

HDFC Bank Futures Key Trading Levels for 27th June 2022HDFC Bank Futures Key Trading Levels for 27th June 2022
Disclaimer: These levels are purely based on Price action/demand and supply zones & and consumed only for educational purpose & should not be taken as buy/sell recommendation. I will not be responsible for any loss/profit incurred if anyone takes trades based on my views.
Please consult your Financial Advisor before making any trading decision.
Leave a comment that is helpful or encouraging. Let's master the markets together.

HDFC Bank Futures Key Trading Levels for 24th June 2022HDFC Bank Futures Key Trading Levels for 24th June 2022
Disclaimer: These levels are purely based on Price action/demand and supply zones & and consumed only for educational purpose & should not be taken as buy/sell recommendation. I will not be responsible for any loss/profit incurred if anyone takes trades based on my views.
Please consult your Financial Advisor before making any trading decision.
Leave a comment that is helpful or encouraging. Let's master the markets together.

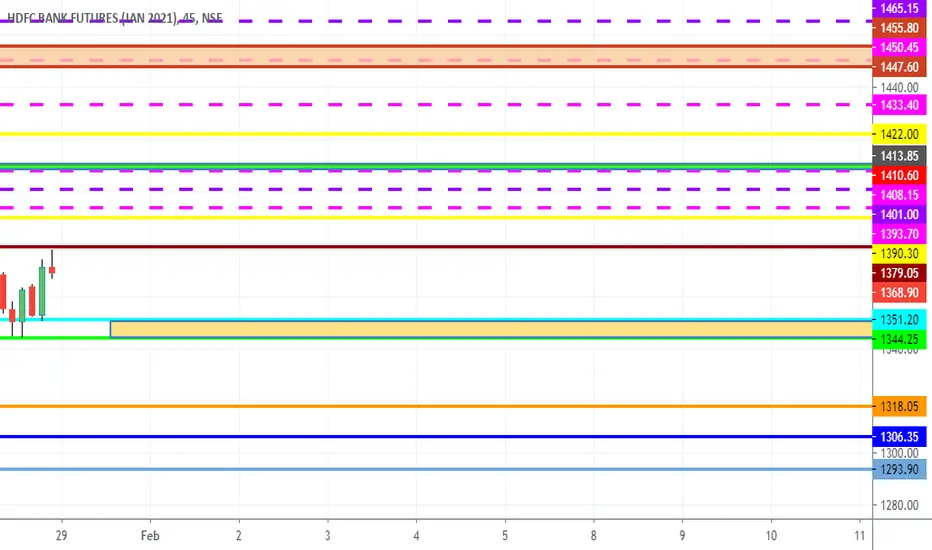
HDFCBANK JuneNSE:HDFCBANK1!
In HDFCBANK
above you can see the important levels and by *auto harmonic patterns* ( cypher ).
On its basis and some analysis we mentioned some targets.
If * 1400 * level break then our
Target 1 ------ 1420
And if upward movement remains continue then our
Target 2------ 1465
And if * 1380 * level break then our
Target 1 ------ 1345
Target 2 ------ 1285
Target 3 ------ 1195
I hope it will help you.👍👍👍
For more such analysis stay connected with us and Checkout our new updates 🤘🤘🤘